PRÁCTICA 5: MODELOS PROBIT Y LOGIT (I)
Anuncio
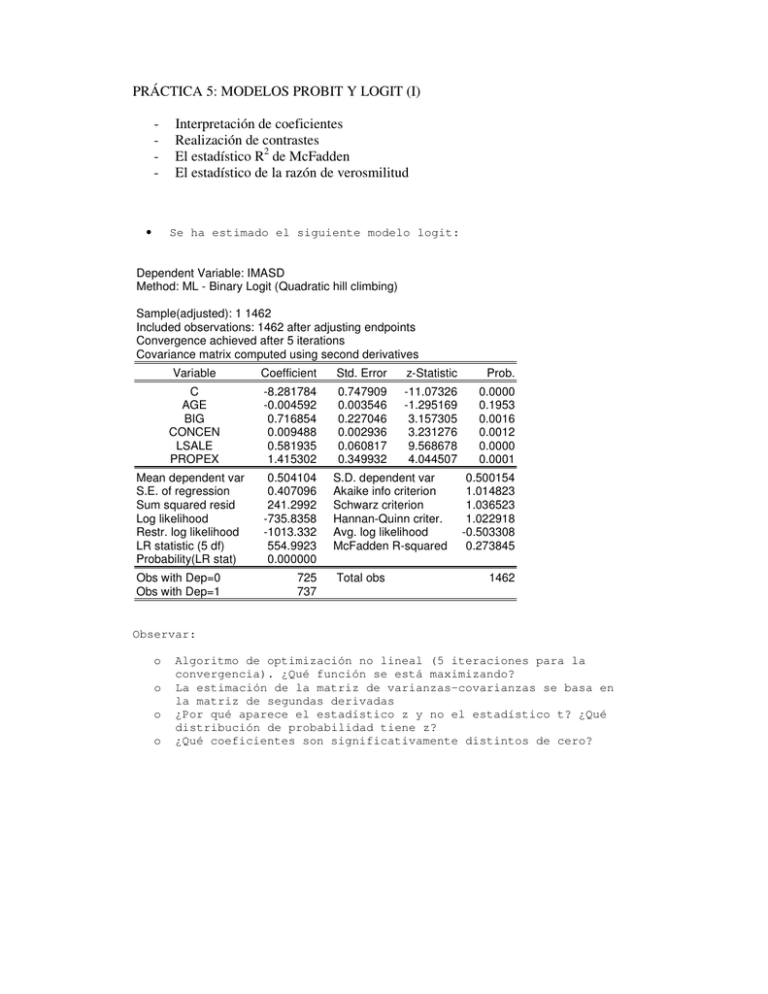
PRÁCTICA 5: MODELOS PROBIT Y LOGIT (I) - • Interpretación de coeficientes Realización de contrastes El estadístico R2 de McFadden El estadístico de la razón de verosmilitud Se ha estimado el siguiente modelo logit: Dependent Variable: IMASD Method: ML - Binary Logit (Quadratic hill climbing) Sample(adjusted): 1 1462 Included observations: 1462 after adjusting endpoints Convergence achieved after 5 iterations Covariance matrix computed using second derivatives Variable Coefficient Std. Error z-Statistic Prob. C AGE BIG CONCEN LSALE PROPEX -8.281784 -0.004592 0.716854 0.009488 0.581935 1.415302 0.747909 0.003546 0.227046 0.002936 0.060817 0.349932 -11.07326 -1.295169 3.157305 3.231276 9.568678 4.044507 0.0000 0.1953 0.0016 0.0012 0.0000 0.0001 Mean dependent var S.E. of regression Sum squared resid Log likelihood Restr. log likelihood LR statistic (5 df) Probability(LR stat) Obs with Dep=0 Obs with Dep=1 0.504104 0.407096 241.2992 -735.8358 -1013.332 554.9923 0.000000 725 737 S.D. dependent var Akaike info criterion Schwarz criterion Hannan-Quinn criter. Avg. log likelihood McFadden R-squared Total obs 0.500154 1.014823 1.036523 1.022918 -0.503308 0.273845 1462 Observar: o o o o Algoritmo de optimización no lineal (5 iteraciones para la convergencia). ¿Qué función se está maximizando? La estimación de la matriz de varianzas-covarianzas se basa en la matriz de segundas derivadas ¿Por qué aparece el estadístico z y no el estadístico t? ¿Qué distribución de probabilidad tiene z? ¿Qué coeficientes son significativamente distintos de cero? • Se ha vuelto a estimar el siguiente modelo logit Dependent Variable: IMASD Method: ML - Binary Logit (Quadratic hill climbing) Sample(adjusted): 1 1462 Included observations: 1462 after adjusting endpoints Convergence achieved after 5 iterations Covariance matrix computed using second derivatives Variable Coefficient Std. Error z-Statistic Prob. C BIG CONCEN LSALE PROPEX -8.132017 0.677001 0.009303 0.565199 1.406879 0.736705 0.224421 0.002929 0.059229 0.349063 -11.03836 3.016656 3.176155 9.542605 4.030439 0.0000 0.0026 0.0015 0.0000 0.0001 Mean dependent var S.E. of regression Sum squared resid Log likelihood Restr. log likelihood LR statistic (4 df) Probability(LR stat) Obs with Dep=0 Obs with Dep=1 0.504104 0.407299 241.7055 -736.6546 -1013.332 553.3546 0.000000 725 737 S.D. dependent var Akaike info criterion Schwarz criterion Hannan-Quinn criter. Avg. log likelihood McFadden R-squared Total obs 0.500154 1.014575 1.032659 1.021321 -0.503868 0.273037 1462 Piense en: o o o o o o o o Interpretación de los coeficientes estimados ¿Cómo puede obtener el impacto marginal sobre la probabilidad a partir de los coeficientes estimados? Si desea obtener el efecto sobre la probabilidad de hacer gasto en I+D del tamaño de la empresa ¿Qué importancia tiene la función de distribución @logit? Si desea obtener el efecto sobre la probabilidad del volumen de ventas¿Qué importancia tiene la función de densidad @logit*(1@logit)? ¿Cómo variaría su respuesta a los dos apartados anteriores si el modelo estimado fuera un probit? ¿y si fuera un MLP? Obtenga el estadístico LR del cuadro de resultados a partir de otra información en el cuadro. Interprete Obtenga el R2 de McFadden a partir de otra información contenida en el cuadro anterior. Interprete ¿Cuántas empresas realizan gastos en I+D en nuestra muestra? • Contraste sobre significatividad conjunta de coeficientes Redundant Variables: PROPEX LSALE F-statistic Log likelihood ratio 80.18278 152.6607 Probability Probability 0.000000 0.000000 Test Equation: Dependent Variable: IMASD Method: Least Squares Date: 03/25/03 Time: 16:17 Sample: 1 1462 Included observations: 1462 Variable Coefficient Std. Error t-Statistic Prob. C BIG CONCEN 0.248289 0.514088 0.002391 0.022744 0.024359 0.000514 10.91662 21.10453 4.650993 0.0000 0.0000 0.0000 R-squared Adjusted R-squared S.E. of regression Sum squared resid Log likelihood Durbin-Watson stat 0.256869 0.255851 0.431454 271.5960 -844.0360 1.821343 Mean dependent var S.D. dependent var Akaike info criterion Schwarz criterion F-statistic Prob(F-statistic) 0.504104 0.500154 1.158736 1.169586 252.1578 0.000000 Piense en: o o ¿Qué se está contrastando en el cuadro anterior? Interprete el cuadro inferior
