Ejemplo estimación MC2E
Anuncio
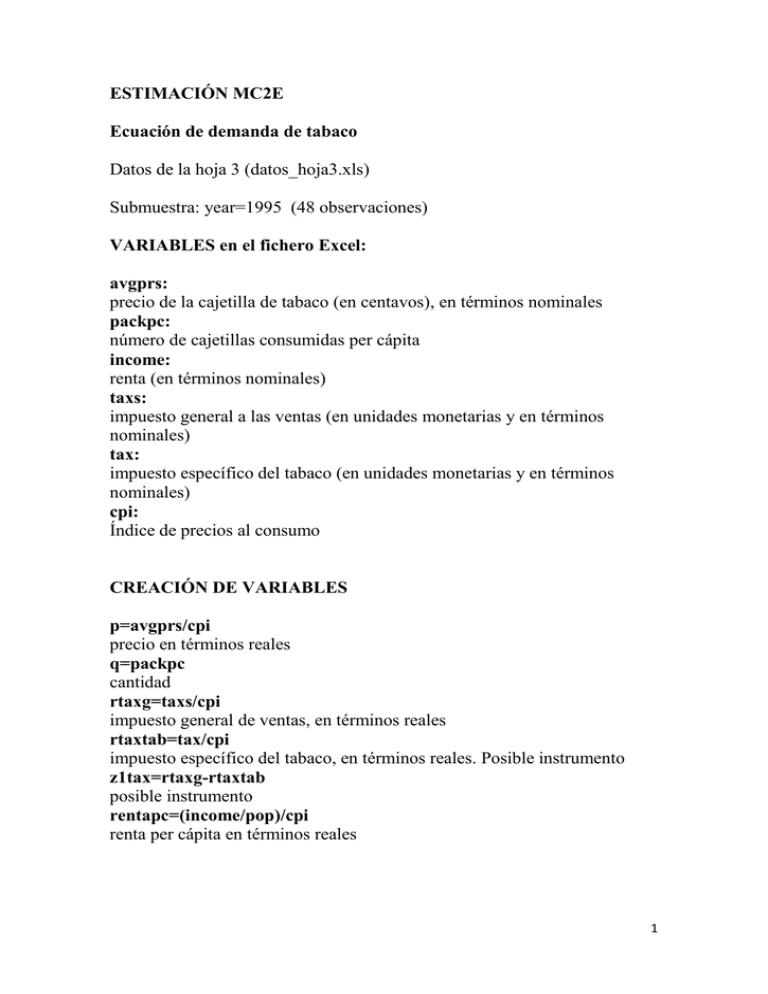
ESTIMACIÓN MC2E Ecuación de demanda de tabaco Datos de la hoja 3 (datos_hoja3.xls) Submuestra: year=1995 (48 observaciones) VARIABLES en el fichero Excel: avgprs: precio de la cajetilla de tabaco (en centavos), en términos nominales packpc: número de cajetillas consumidas per cápita income: renta (en términos nominales) taxs: impuesto general a las ventas (en unidades monetarias y en términos nominales) tax: impuesto específico del tabaco (en unidades monetarias y en términos nominales) cpi: Índice de precios al consumo CREACIÓN DE VARIABLES p=avgprs/cpi precio en términos reales q=packpc cantidad rtaxg=taxs/cpi impuesto general de ventas, en términos reales rtaxtab=tax/cpi impuesto específico del tabaco, en términos reales. Posible instrumento z1tax=rtaxg-rtaxtab posible instrumento rentapc=(income/pop)/cpi renta per cápita en términos reales 1 ECUACIÓN DE DEMANDA DE TABACO REGRESIÓN SIMPLE 1 instrumento: z1tax Estimación MC2E (primera etapa) Dependent Variable: LOG(P) Method: Least Squares Date: 11/24/10 Time: 10:58 Sample: 1 96 IF YEAR=1995 Included observations: 48 White Heteroskedasticity-Consistent Standard Errors & Covariance Variable Coefficient Std. Error t-Statistic Prob. C Z1TAX 4.616546 0.030729 0.028918 0.004835 159.6444 6.354935 0.0000 0.0000 R-squared Adjusted R-squared S.E. of regression Sum squared resid Log likelihood F-statistic Prob(F-statistic) 0.470996 0.459496 0.093945 0.405979 46.43466 40.95588 0.000000 Mean dependent var S.D. dependent var Akaike info criterion Schwarz criterion Hannan-Quinn criter. Durbin-Watson stat 4.781380 0.127783 -1.851444 -1.773478 -1.821981 2.008192 Estimación MC2E (segunda etapa) Dependent Variable: LOG(Q) Method: Least Squares Date: 11/24/10 Time: 11:00 Sample: 1 96 IF YEAR=1995 Included observations: 48 White Heteroskedasticity-Consistent Standard Errors & Covariance Variable Coefficient Std. Error t-Statistic Prob. C EST_LOGP 9.719877 -1.083587 1.597119 0.333695 6.085882 -3.247237 0.0000 0.0022 R-squared Adjusted R-squared S.E. of regression Sum squared resid Log likelihood F-statistic Prob(F-statistic) 0.152490 0.134066 0.226447 2.358809 4.204011 8.276648 0.006069 Mean dependent var S.D. dependent var Akaike info criterion Schwarz criterion Hannan-Quinn criter. Durbin-Watson stat 4.538837 0.243346 -0.091834 -0.013867 -0.062370 2.099150 2 Estimación MC2E en un solo paso Dependent Variable: LOG(Q) Method: Two-Stage Least Squares Date: 11/24/10 Time: 11:01 Sample: 1 96 IF YEAR=1995 Included observations: 48 White Heteroskedasticity-Consistent Standard Errors & Covariance Instrument list: Z1TAX Variable Coefficient Std. Error t-Statistic Prob. C LOG(P) 9.719877 -1.083587 1.528322 0.318918 6.359835 -3.397693 0.0000 0.0014 R-squared Adjusted R-squared S.E. of regression F-statistic Prob(F-statistic) 0.401129 0.388110 0.190354 11.71294 0.001313 Mean dependent var S.D. dependent var Sum squared resid Durbin-Watson stat Second-Stage SSR 4.538837 0.243346 1.666792 1.992587 2.358809 ESTIMACIÓN DE DEMANDA DE TABACO Regresión múltiple: dos regresores: precio (endógeno), renta(exógeno) Instrumento: z1tax MC2E en un solo paso Dependent Variable: LOG(Q) Method: Two-Stage Least Squares Date: 11/24/10 Time: 11:04 Sample: 1 96 IF YEAR=1995 Included observations: 48 White Heteroskedasticity-Consistent Standard Errors & Covariance Instrument list: Z1TAX LOG(RENTAPC) Variable Coefficient Std. Error t-Statistic Prob. C LOG(P) LOG(RENTAPC) 9.430658 -1.143375 0.214515 1.259393 0.372303 0.311747 7.488260 -3.071090 0.688107 0.0000 0.0036 0.4949 R-squared Adjusted R-squared S.E. of regression F-statistic Prob(F-statistic) 0.418934 0.393109 0.189575 6.533672 0.003227 Mean dependent var S.D. dependent var Sum squared resid Durbin-Watson stat Second-Stage SSR 4.538837 0.243346 1.617235 1.960299 2.313601 3 ESTIMACIÓN DE DEMANDA DE TABACO Regresión múltiple: dos regresores: precio (endógeno), renta(exógeno) Instrumentos: z1tax, rtaxtab MC2E en un solo paso Dependent Variable: LOG(Q) Method: Two-Stage Least Squares Date: 11/24/10 Time: 11:07 Sample: 1 96 IF YEAR=1995 Included observations: 48 White Heteroskedasticity-Consistent Standard Errors & Covariance Instrument list: Z1TAX RTAXTAB LOG(RENTAPC) Variable Coefficient Std. Error t-Statistic Prob. C LOG(P) LOG(RENTAPC) 9.894956 -1.277424 0.280405 0.959217 0.249610 0.253890 10.31566 -5.117680 1.104436 0.0000 0.0000 0.2753 R-squared Adjusted R-squared S.E. of regression F-statistic Prob(F-statistic) 0.429422 0.404063 0.187856 13.28079 0.000029 Mean dependent var S.D. dependent var Sum squared resid Durbin-Watson stat Second-Stage SSR 4.538837 0.243346 1.588044 1.946351 1.845868 4
