Contrastación de hipótesis básicas: MULTICOLINEALIDAD Se
Anuncio
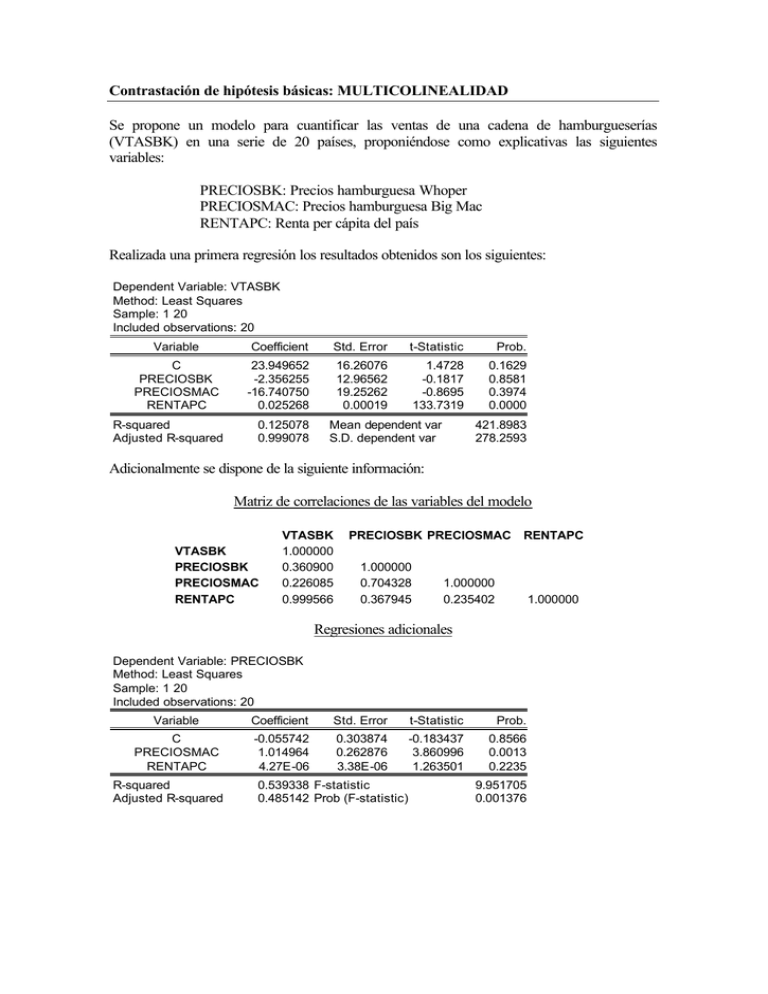
Contrastación de hipótesis básicas: MULTICOLINEALIDAD Se propone un modelo para cuantificar las ventas de una cadena de hamburgueserías (VTASBK) en una serie de 20 países, proponiéndose como explicativas las siguientes variables: PRECIOSBK: Precios hamburguesa Whoper PRECIOSMAC: Precios hamburguesa Big Mac RENTAPC: Renta per cápita del país Realizada una primera regresión los resultados obtenidos son los siguientes: Dependent Variable: VTASBK Method: Least Squares Sample: 1 20 Included observations: 20 Variable Coefficient Std. Error t-Statistic Prob. C PRECIOSBK PRECIOSMAC RENTAPC 23.949652 -2.356255 -16.740750 0.025268 16.26076 12.96562 19.25262 0.00019 1.4728 -0.1817 -0.8695 133.7319 0.1629 0.8581 0.3974 0.0000 R-squared Adjusted R-squared 0.125078 0.999078 Mean dependent var S.D. dependent var 421.8983 278.2593 Adicionalmente se dispone de la siguiente información: Matriz de correlaciones de las variables del modelo VTASBK PRECIOSBK PRECIOSMAC RENTAPC VTASBK 1.000000 0.360900 0.226085 0.999566 PRECIOSBK PRECIOSMAC RENTAPC 1.000000 0.704328 0.367945 1.000000 0.235402 1.000000 Regresiones adicionales Dependent Variable: PRECIOSBK Method: Least Squares Sample: 1 20 Included observations: 20 Variable Coefficient Std. Error t-Statistic Prob. C PRECIOSMAC RENTAPC -0.055742 1.014964 4.27E-06 0.303874 0.262876 3.38E-06 -0.183437 3.860996 1.263501 0.8566 0.0013 0.2235 R-squared Adjusted R-squared 0.539338 F-statistic 0.485142 Prob (F-statistic) 9.951705 0.001376 Dependent Variable: PRECIOSMAC Method: Least Squares Sample: 1 20 Included observations: 20 Variable Coefficient Std. Error t-Statistic Prob. C RENTAPC PRECIOSBK 0.627244 -3.53E-07 0.460318 0.137180 2.38E-06 0.119223 4.572405 -0.148464 3.860996 0.0003 0.8837 0.0013 R-squared Adjusted R-squared 0.496731 F-statistic 0.437522 Prob (F-statistic) 8.389564 0.002919 Dependent Variable: RENTAPC Method: Least Squares Sample: 1 20 Included observations: 20 Variable Coefficient Std. Error t-Statistic Prob. C PRECIOSMAC PRECIOSBK -3401.993 -3665.249 20098.02 20848.54 24687.84 15906.61 -0.163177 -0.148464 1.263501 0.8723 0.8837 0.2235 R-squared Adjusted R-squared 0.136503 F-statistic 0.034915 Prob (F-statistic) 1.343696 0.287221 En base a la información disponible identifique si el modelo propuesto presenta problemas de multicolinealidad.
