2. Obtenga la función de autocovarianza teórica de orden 2, ?2, de
Anuncio
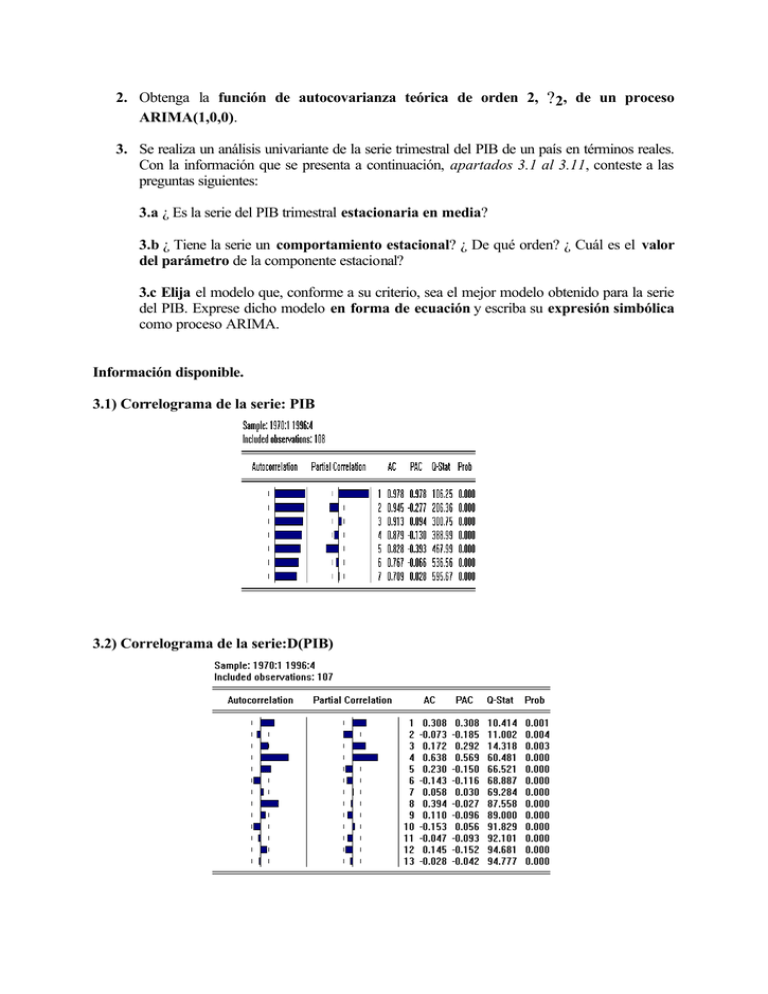
2. Obtenga la función de autocovarianza teórica de orden 2, ? 2, de un proceso ARIMA(1,0,0). 3. Se realiza un análisis univariante de la serie trimestral del PIB de un país en términos reales. Con la información que se presenta a continuación, apartados 3.1 al 3.11, conteste a las preguntas siguientes: 3.a ¿ Es la serie del PIB trimestral estacionaria en media? 3.b ¿ Tiene la serie un comportamiento estacional? ¿ De qué orden? ¿ Cuál es el valor del parámetro de la componente estacional? 3.c Elija el modelo que, conforme a su criterio, sea el mejor modelo obtenido para la serie del PIB. Exprese dicho modelo en forma de ecuación y escriba su expresión simbólica como proceso ARIMA. Información disponible. 3.1) Correlograma de la serie: PIB 3.2) Correlograma de la serie:D(PIB) 3.3) Regresión nº1 LS // Dependent Variable is PIB Sample(adjusted): 1970:2 1996:4 Included observations: 107 after adjusting endpoints Variable AR(1) Coefficient 1.002042 R-squared Adjusted R-squared S.E. of regression Sum squared resid Log likelihood Std. Error 0.002455 0.972877 0.972877 1.594899 269.6326 -201.2728 t-Statistic 408.0897 Prob. 0.0000 Mean dependent var S.D. dependent var Akaike info criterion Schwarz criterion Durbin-Watson stat -62.19879 9.684223 0.942923 0.967903 1.356204 3.4) Regresión nº2 LS // Dependent Variable is D(PIB) Sample(adjusted): 1971:1 1996:4 Included observations: 104 after adjusting endpoints Variable AR(1) AR(2) AR(3) Coefficient 0.436293 -0.280838 0.301599 R-squared Adjusted R-squared S.E. of regression Sum squared resid Log likelihood Durbin-Watson stat Std. Error 0.094192 0.099797 0.093552 0.205826 0.190100 1.417702 202.9979 -182.3475 2.371611 t-Statistic 4.631966 -2.814097 3.223850 Prob. 0.0000 0.0059 0.0017 Mean dependent var S.D. dependent var Akaike info criterion Schwarz criterion F-statistic Prob(F-statistic) -0.155388 1.575322 0.726497 0.802778 13.08807 0.000009 3.5) Correlograma de la serie: Residuos de la regresión 2 3.6) Regresión nº3 LS // Dependent Variable is D(PIB) Sample(adjusted): 1971:2 1996:4 Included observations: 103 after adjusting endpoints Variable SAR(4) Coefficient 0.662565 R-squared Adjusted R-squared S.E. of regression Sum squared resid Log likelihood 1.336476 Std. Error 0.072643 0.444126 0.444126 1.179852 141.9891 -162.6833 t-Statistic 9.120845 Prob. 0.0000 Mean dependent var -0.151349 S.D. dependent var 1.582484 Akaike info criterion 0.340439 Schwarz criterion 0.366019 Durbin-Watson stat 3.7) Correlograma de la serie: Residuos de la regresión 3 3.8) Regresión nº4 LS // Dependent Variable is D(PIB) Sample(adjusted): 1971:3 1996:4 Included observations: 102 after adjusting endpoints Variable AR(1) SAR(4) Coefficient 0.323885 0.638918 R-squared Adjusted R-squared S.E. of regression Sum squared resid Log likelihood Durbin-Watson stat Std. Error 0.094403 0.073605 0.488775 0.483662 1.119300 125.2833 -155.2176 2.032223 t-Statistic 3.430878 8.680411 Prob. 0.0009 0.0000 Mean dependent var S.D. dependent var Akaike info criterion Schwarz criterion F-statistic Prob(F-statistic) 3.9) Correlograma de la serie: Residuos de la regresión 4 -0.182766 1.557685 0.244821 0.296291 95.60840 0.000000 3.10) Regresión nº5 LS // Dependent Variable is D(PIB) Sample(adjusted): 1971:2 1996:4 Included observations: 103 after adjusting endpoints Variable SAR(4) MA(1) Coefficient 0.641742 0.289083 R-squared Adjusted R-squared S.E. of regression Sum squared resid Log likelihood Durbin-Watson stat Std. Error 0.074385 0.095443 0.494147 0.489139 1.131073 129.2120 -157.8270 1.926367 t-Statistic 8.627281 3.028851 Prob. 0.0000 0.0031 Mean dependent var S.D. dependent var Akaike info criterion Schwarz criterion F-statistic Prob(F-statistic) 3.11) Correlograma de la serie: Residuos de la regresión 5 -0.151349 1.582484 0.265561 0.316720 98.66284 0.000000
