The above screenshot shows an example of what the user
Anuncio
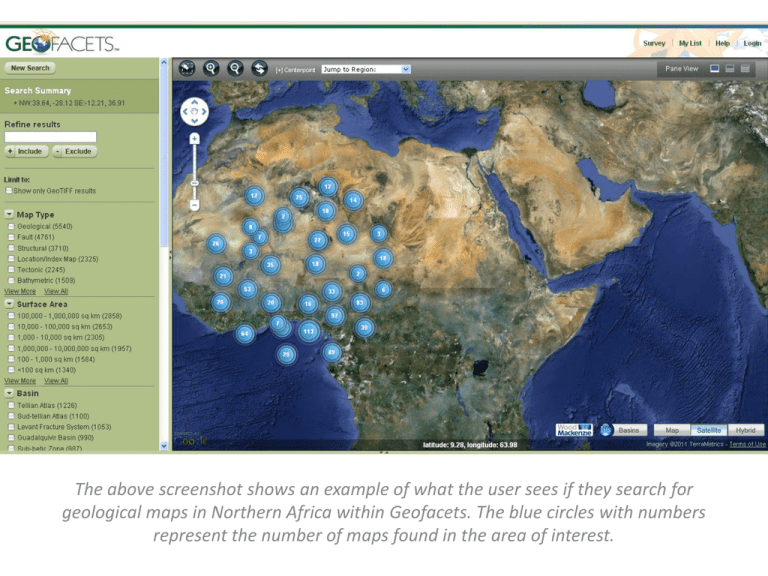
The above screenshot shows an example of what the user sees if they search for geological maps in Northern Africa within Geofacets. The blue circles with numbers represent the number of maps found in the area of interest. In this version of the same screenshot, the user has selected to view what range of Development Value the different countries fall under, using the Wood Mackenzie map overlay feature. The legend on the top-right shows what development value ranges the three different colors represent.
