9. SPAIN
Anuncio
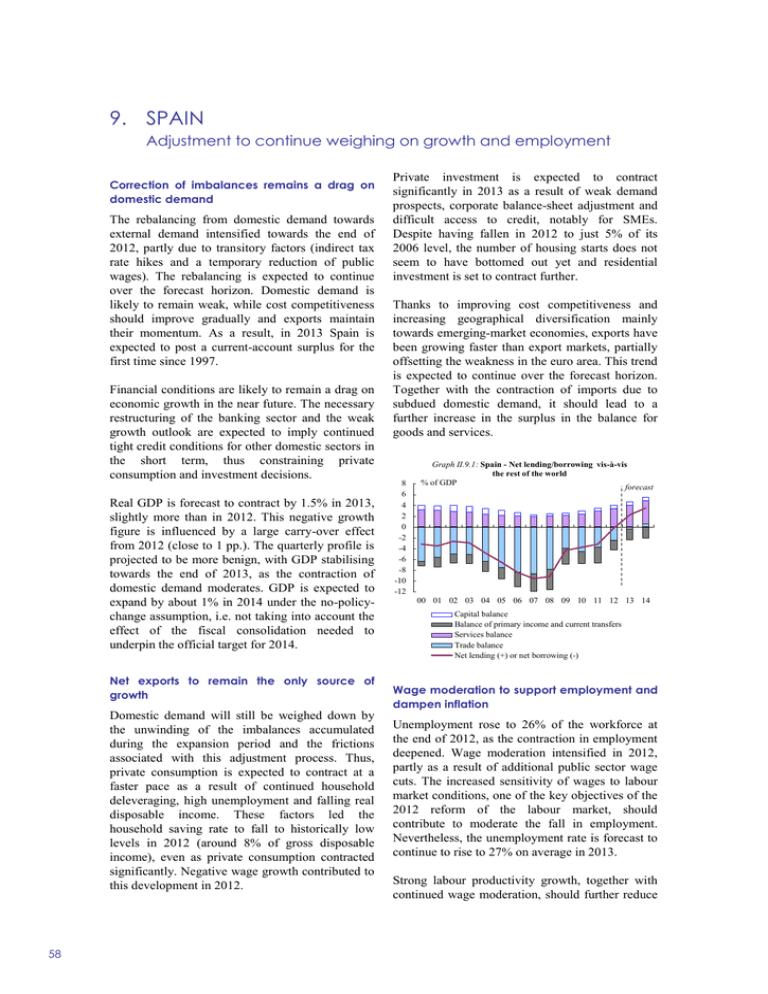
9. SPAIN Adjustment to continue weighing on growth and employment Correction of imbalances remains a drag on domestic demand The rebalancing from domestic demand towards external demand intensified towards the end of 2012, partly due to transitory factors (indirect tax rate hikes and a temporary reduction of public wages). The rebalancing is expected to continue over the forecast horizon. Domestic demand is likely to remain weak, while cost competitiveness should improve gradually and exports maintain their momentum. As a result, in 2013 Spain is expected to post a current-account surplus for the first time since 1997. Financial conditions are likely to remain a drag on economic growth in the near future. The necessary restructuring of the banking sector and the weak growth outlook are expected to imply continued tight credit conditions for other domestic sectors in the short term, thus constraining private consumption and investment decisions. Real GDP is forecast to contract by 1.5% in 2013, slightly more than in 2012. This negative growth figure is influenced by a large carry-over effect from 2012 (close to 1 pp.). The quarterly profile is projected to be more benign, with GDP stabilising towards the end of 2013, as the contraction of domestic demand moderates. GDP is expected to expand by about 1% in 2014 under the no-policychange assumption, i.e. not taking into account the effect of the fiscal consolidation needed to underpin the official target for 2014. Net exports to remain the only source of growth Domestic demand will still be weighed down by the unwinding of the imbalances accumulated during the expansion period and the frictions associated with this adjustment process. Thus, private consumption is expected to contract at a faster pace as a result of continued household deleveraging, high unemployment and falling real disposable income. These factors led the household saving rate to fall to historically low levels in 2012 (around 8% of gross disposable income), even as private consumption contracted significantly. Negative wage growth contributed to this development in 2012. 58 Private investment is expected to contract significantly in 2013 as a result of weak demand prospects, corporate balance-sheet adjustment and difficult access to credit, notably for SMEs. Despite having fallen in 2012 to just 5% of its 2006 level, the number of housing starts does not seem to have bottomed out yet and residential investment is set to contract further. Thanks to improving cost competitiveness and increasing geographical diversification mainly towards emerging-market economies, exports have been growing faster than export markets, partially offsetting the weakness in the euro area. This trend is expected to continue over the forecast horizon. Together with the contraction of imports due to subdued domestic demand, it should lead to a further increase in the surplus in the balance for goods and services. 8 6 4 2 0 -2 -4 -6 -8 -10 -12 Graph II.9.1: Spain - Net lending/borrowing vis-à-vis the rest of the world % of GDP forecast 00 01 02 03 04 05 06 07 08 09 10 11 12 13 14 Capital balance Balance of primary income and current transfers Services balance Trade balance Net lending (+) or net borrowing (-) Wage moderation to support employment and dampen inflation Unemployment rose to 26% of the workforce at the end of 2012, as the contraction in employment deepened. Wage moderation intensified in 2012, partly as a result of additional public sector wage cuts. The increased sensitivity of wages to labour market conditions, one of the key objectives of the 2012 reform of the labour market, should contribute to moderate the fall in employment. Nevertheless, the unemployment rate is forecast to continue to rise to 27% on average in 2013. Strong labour productivity growth, together with continued wage moderation, should further reduce Member States, Spain nominal unit labour costs in 2013. Inflation is set to fall significantly towards the end of 2013 once the effects of hikes in indirect taxes and administered prices fade out. Amid wage moderation and subdued domestic demand, inflation is projected to fall below 1% in 2014. consumption patterns and the slump in housing transactions), falling employment and labour income, and negative asset price developments. Additional revenue-raising measures introduced throughout the year largely offset these shortfalls. In 2013, the general government deficit (net of bank recapitalisations) is expected to narrow to 6.5% of GDP, thanks to discretionary measures of around 2.5% of GDP, which more than offset the negative budgetary impact of the continued recession and population ageing. Higher VAT revenues and expenditure savings should outweigh higher expenditure on social transfers and interest. Despite the return to positive, albeit weak, growth in 2014, the general government deficit is expected to widen to 7% of GDP, as some of the measures introduced in 2012 would expire (against an official target of 5.5% of GDP). In such a nopolicy-change assumption, the structural deficit is estimated to be back at its 2012 level in 2014. Recession and structural adjustments take their toll on government revenues With the entry into force of the additional consolidation measures taken during the year (increase in VAT, elimination of the Christmas bonus in the public sector, corporate tax measures), budgetary consolidation advanced in the final months of 2012. Also at regional level, expenditure cuts in the area of education had their main impact in the last quarter. For the year as a whole, the deficit narrowed to 7.0% of GDP, down from 8.9% in 2011, net of bank recapitalisations in both years. The latter amounted to around 3.6% of GDP in 2012 according to the April 2013 EDP notification. Large public deficits, low nominal GDP growth and bank recapitalisation costs are projected to raise the general government gross debt by more than 12 pps. to 96.8% of GDP between 2012 and 2014. The budgetary performance in 2012 was blighted by considerable shortfalls of both indirect and direct tax revenues, linked to negative composition effects (due, inter alia, to shifts in private Table II.9.1: Main features of country forecast - SPAIN 2011 GDP Private consumption Public consumption Gross fixed capital formation of which : equipment Exports (goods and services) Imports (goods and services) GNI (GDP deflator) Contribution to GDP growth : Annual percentage change bn EUR Curr. prices % GDP 92-08 2009 2010 2011 2012 2013 1063.4 100.0 3.0 -3.7 -0.3 0.4 -1.4 -1.5 0.9 620.0 58.3 2.8 -3.8 0.7 -1.0 -2.1 -3.1 -0.1 222.7 20.9 3.9 3.7 1.5 -0.5 -3.7 -3.7 -0.4 224.0 21.1 3.7 -18.0 -6.2 -5.3 -9.1 -7.6 -1.1 63.0 5.9 4.2 -24.5 3.0 2.4 -6.7 -5.8 0.1 321.8 30.3 7.1 -10.0 11.3 7.6 3.1 4.1 5.7 330.3 31.1 7.5 -17.2 9.2 -0.9 -5.0 -4.0 2.0 1041.9 98.0 2.8 -3.0 0.3 -0.3 -0.5 -1.6 0.9 3.3 -6.6 -0.8 -1.8 -3.9 -4.0 -0.4 Domestic demand Inventories Net exports Employment Unemployment rate (a) Compensation of employees/f.t.e. Unit labour costs whole economy Real unit labour costs Saving rate of households (b) GDP deflator Harmonised index of consumer prices Terms of trade of goods Merchandise trade balance (c) Current-account balance (c) Net lending(+) or borrowing(-) vis-à-vis ROW (c) General government balance (c) Cyclically-adjusted budget balance (c) Structural budget balance (c) General government gross debt (c) 2014 0.0 0.0 0.1 -0.1 0.0 0.0 0.0 -0.3 2.9 0.3 2.3 2.5 2.6 1.3 2.1 -6.5 -2.3 -1.7 -4.4 -3.4 0.0 13.9 18.0 20.1 21.7 25.0 27.0 26.4 4.2 4.4 0.0 0.7 -0.3 1.4 0.1 3.4 1.5 -2.0 -1.4 -3.4 -0.6 -0.8 -0.5 1.4 -2.4 -2.4 -3.5 -2.2 -1.8 - 17.8 13.1 11.0 8.2 8.0 8.9 3.8 0.1 0.4 1.0 0.1 1.6 1.0 - -0.2 2.0 3.1 2.4 1.5 0.8 0.2 4.5 -2.2 -3.3 -2.2 0.1 0.3 -5.2 -4.0 -4.6 -3.8 -2.4 -0.4 0.6 -4.0 -4.8 -4.4 -3.7 -0.9 1.6 2.9 -3.2 -4.3 -3.8 -3.2 -0.2 2.2 3.5 - -11.2 -9.7 -9.4 -10.6 -6.5 -7.0 - -9.2 -7.4 -7.5 -8.4 -4.3 -5.9 - -8.5 -7.4 -7.2 -5.5 -4.4 -5.5 53.4 53.9 61.5 69.3 84.2 91.3 96.8 (a) Eurostat definition. (b) gross saving divided by gross disposable income. (c) as a percentage of GDP. 59
