Result report 2010 - CorpBanca Inversiones
Anuncio
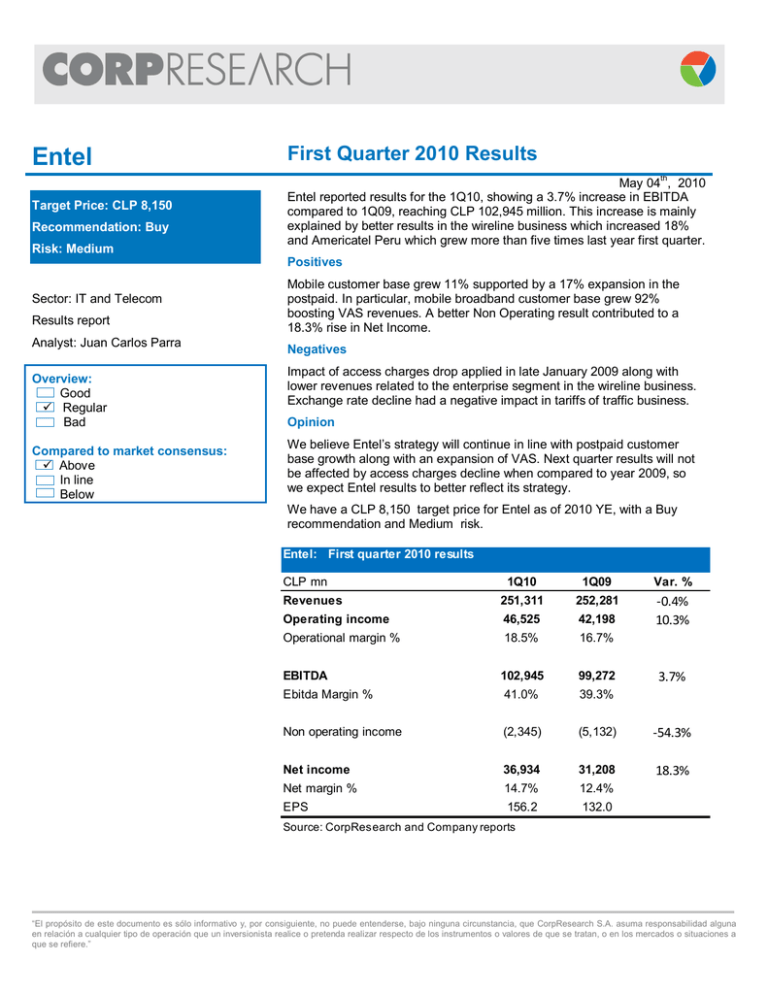
Entel First Quarter 2010 Results Target Price: CLP 8,150 May 04th, 2010 Entel reported results for the 1Q10, showing a 3.7% increase in EBITDA compared to 1Q09, reaching CLP 102,945 million. This increase is mainly explained by better results in the wireline business which increased 18% and Americatel Peru which grew more than five times last year first quarter. Recommendation: Buy Risk: Medium Positives Sector: IT and Telecom Results report Analyst: Juan Carlos Parra Overview: Good Regular Bad Compared to market consensus: Above In line Below Mobile customer base grew 11% supported by a 17% expansion in the postpaid. In particular, mobile broadband customer base grew 92% boosting VAS revenues. A better Non Operating result contributed to a 18.3% rise in Net Income. Negatives Impact of access charges drop applied in late January 2009 along with lower revenues related to the enterprise segment in the wireline business. Exchange rate decline had a negative impact in tariffs of traffic business. Opinion We believe Entel’s strategy will continue in line with postpaid customer base growth along with an expansion of VAS. Next quarter results will not be affected by access charges decline when compared to year 2009, so we expect Entel results to better reflect its strategy. We have a CLP 8,150 target price for Entel as of 2010 YE, with a Buy recommendation and Medium risk. Entel: First quarter 2010 results CLP mn 1Q10 1Q09 Var. % Revenues 251,311 252,281 Operating income 46,525 42,198 -0.4% 10.3% Operational margin % 18.5% 16.7% EBITDA 102,945 99,272 Ebitda Margin % 41.0% 39.3% Non operating income (2,345) (5,132) -54.3% Net income 36,934 31,208 18.3% Net margin % 14.7% 12.4% EPS 156.2 132.0 3.7% Source: CorpResearch and Company reports “El propósito de este documento es sólo informativo y, por consiguiente, no puede entenderse, bajo ninguna circunstancia, que CorpResearch S.A. asuma responsabilidad alguna en relación a cualquier tipo de operación que un inversionista realice o pretenda realizar respecto de los instrumentos o valores de que se tratan, o en los mercados o situaciones a que se refiere.” Glossary Term Definition / Translation Calculation EBITDA Earnings Before Interests, Taxes, Depreciation and Amortization Operational Income plus Depreciation and Amortization EBITDAR Earnings Before Interests, Taxes, Depreciation, Amortization and Rents EV Enterprise Value EV/EBITDA Valuation multiple. While greater it is, more expensive it is the stock Operational Income plus Depreciation and Amortization plus rent of fixed assets. It is used the at transport industries to reverse the rent of airplanes or ships. Market capitalization plus Net Financial Debt plus Minority Interest EV divided by Ebitda FCF Free Cash Flow Operational Income plus Depreciation and Amortization minus tax minus capital expenditures plus (minus) working capital variation. Free-float Percentage of stocks that can be freely traded in the market Percentage of stock that does not belong to controller’s shareholders. Margin Operational Ebitda Net Percentage of sales P/E Price / Earnings Market Price divided by EPS P/B Price to Book value ratio Market price divided by the accounting value of the stock. Dividend Yield The return in terms of dividends of investing in equities Dividends distributed in a year divided by the market price. FCF yield Free Cash Flow Return. FCF / Market Price ROA Return on Assets Net Income / Total Assets ROE Return on Equity Net Income / Accounting capitalization EPS Earnings Per Share Net Income / Shares outstanding YtD Year to Date Percentage variation year to date x Times Operational Income / Revenue Ebitda / Revenue Net Income / Revenue Stocks recommendations: these are established according to the stock yield relative to the IPSA. We define a yield to be “In line with the IPSA” when it is within a range whose scope is equivalent to a third of the variation expected for the index, with a minimum of 5%. Once that is settled, we recommend Hold, when we expect the share to have a yield in line with the IPSA; Buy, when the yield expected for the share is above to that expected for the IPSA; and Sell, when the yield expected for the share is below to that expected for the IPSA. 2 “El propósito de este documento es sólo informativo y, por consiguiente, no puede entenderse, bajo ninguna circunstancia, que CorpResearch S.A. asuma responsabilidad alguna en relación a cualquier tipo de operación que un inversionista realice o pretenda realizar respecto de los instrumentos o valores de que se tratan, o en los mercados o situaciones a que se refiere.” CorpResearch Álvaro Donoso CorpResearch Director [email protected] Economic Research Sebastián Cerda Economic Studies Director [email protected] Juan José Donoso Economic Analyst [email protected] Nicolas Birkner Economic Analyst [email protected] Equities Research Cristina Acle Head of Equities Research. Sectors: Forestry and Transport [email protected] Juan Carlos Parra Analyst. Sector: Mining, Foods, IT and Telecom [email protected] Rosario Letelier Analyst. Sector: Energy and Construction [email protected] Gutenberg Martínez Analyst. Sector: Retail and Banks [email protected] Francisco Yazigi Analyst. [email protected] Communications Antonia de la Maza Communications Editor [email protected] Rosario Norte 660 Floor 17, Las Condes, Santiago, Chile. Telephone: (562) 660 3600 www.corpcapital.cl - Bloomberg: CORG <GO> 3 “El propósito de este documento es sólo informativo y, por consiguiente, no puede entenderse, bajo ninguna circunstancia, que CorpResearch S.A. asuma responsabilidad alguna en relación a cualquier tipo de operación que un inversionista realice o pretenda realizar respecto de los instrumentos o valores de que se tratan, o en los mercados o situaciones a que se refiere.”
