Statistical_Bulletin_n21_en PDF | 1.023 Mb
Anuncio
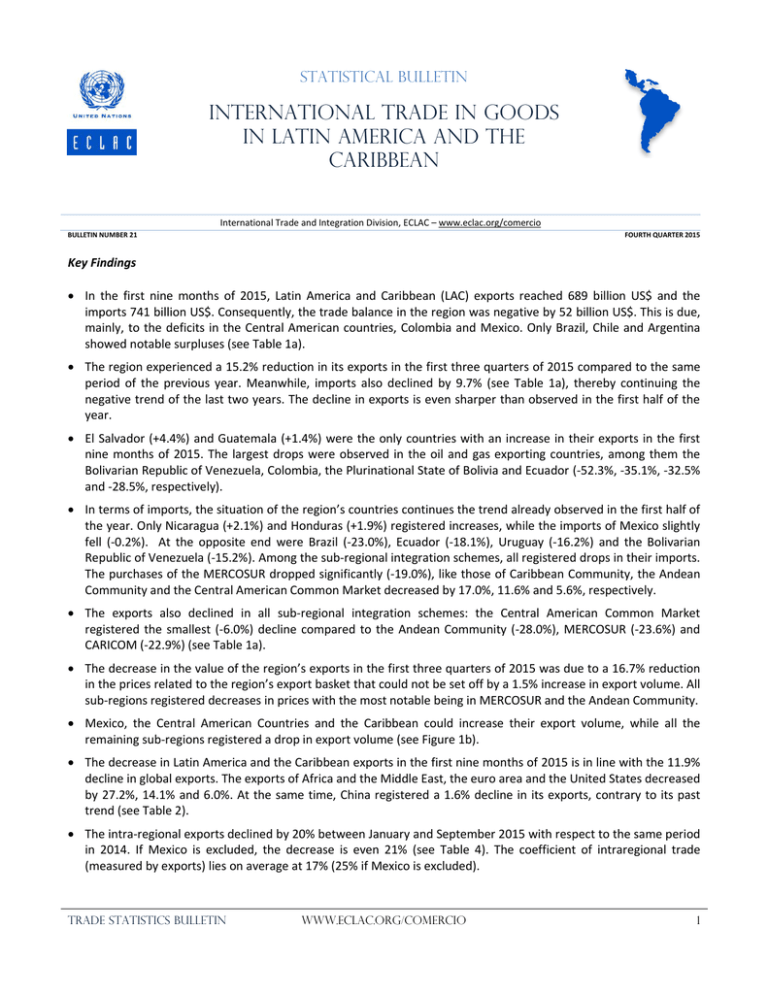
Statistical Bulletin International Trade in Goods in Latin America and the Caribbean International Trade and Integration Division, ECLAC – www.eclac.org/comercio BULLETIN NUMBER 21 FOURTH QUARTER 2015 Key Findings In the first nine months of 2015, Latin America and Caribbean (LAC) exports reached 689 billion US$ and the imports 741 billion US$. Consequently, the trade balance in the region was negative by 52 billion US$. This is due, mainly, to the deficits in the Central American countries, Colombia and Mexico. Only Brazil, Chile and Argentina showed notable surpluses (see Table 1a). The region experienced a 15.2% reduction in its exports in the first three quarters of 2015 compared to the same period of the previous year. Meanwhile, imports also declined by 9.7% (see Table 1a), thereby continuing the negative trend of the last two years. The decline in exports is even sharper than observed in the first half of the year. El Salvador (+4.4%) and Guatemala (+1.4%) were the only countries with an increase in their exports in the first nine months of 2015. The largest drops were observed in the oil and gas exporting countries, among them the Bolivarian Republic of Venezuela, Colombia, the Plurinational State of Bolivia and Ecuador (-52.3%, -35.1%, -32.5% and -28.5%, respectively). In terms of imports, the situation of the region’s countries continues the trend already observed in the first half of the year. Only Nicaragua (+2.1%) and Honduras (+1.9%) registered increases, while the imports of Mexico slightly fell (-0.2%). At the opposite end were Brazil (-23.0%), Ecuador (-18.1%), Uruguay (-16.2%) and the Bolivarian Republic of Venezuela (-15.2%). Among the sub-regional integration schemes, all registered drops in their imports. The purchases of the MERCOSUR dropped significantly (-19.0%), like those of Caribbean Community, the Andean Community and the Central American Common Market decreased by 17.0%, 11.6% and 5.6%, respectively. The exports also declined in all sub-regional integration schemes: the Central American Common Market registered the smallest (-6.0%) decline compared to the Andean Community (-28.0%), MERCOSUR (-23.6%) and CARICOM (-22.9%) (see Table 1a). The decrease in the value of the region’s exports in the first three quarters of 2015 was due to a 16.7% reduction in the prices related to the region’s export basket that could not be set off by a 1.5% increase in export volume. All sub-regions registered decreases in prices with the most notable being in MERCOSUR and the Andean Community. Mexico, the Central American Countries and the Caribbean could increase their export volume, while all the remaining sub-regions registered a drop in export volume (see Figure 1b). The decrease in Latin America and the Caribbean exports in the first nine months of 2015 is in line with the 11.9% decline in global exports. The exports of Africa and the Middle East, the euro area and the United States decreased by 27.2%, 14.1% and 6.0%. At the same time, China registered a 1.6% decline in its exports, contrary to its past trend (see Table 2). The intra-regional exports declined by 20% between January and September 2015 with respect to the same period in 2014. If Mexico is excluded, the decrease is even 21% (see Table 4). The coefficient of intraregional trade (measured by exports) lies on average at 17% (25% if Mexico is excluded). TRADE STATISTICS BULLETIN WWW.ECLAC.ORG/COMERCIO 1 A – Trade by Origin and Destination Table 1. Latin America and the Caribbean: Trends in Goods Exports. (Millions of current US$ and growth rates in percentages) a) Accumulated, January – September 2015 January-September 2015 Argentina Bolivia, Plurinational State of Brazil Chile Colombia Costa Rica Cuba Dominican Republic Ecuador El Salvador Guatemala Honduras Mexico Nicaragua Panama Paraguay Peru Uruguay Venezuela, Bolivarian Republic of Latin America and the Caribbean Andean Community (ANC) Caribbean Community (CARICOM) Central American Common Market (CACM) Southern Common Market (MERCOSUR) Exports 47 311 6 776 144 495 48 342 27 873 7 258 6 247 7 254 14 272 4 200 8 281 2 907 284 631 1 905 536 6 562 24 216 6 068 28 818 688 998 73 137 11 044 25 088 233 254 Import 45 712 6 532 134 254 44 106 41 140 11 473 4 970 9 971 16 699 7 858 13 230 7 124 295 153 4 303 8 916 7 208 28 600 7 306 31 034 741 202 92 970 15 613 52 904 225 514 Balance 1 599 244 10 241 4 236 -13 267 -4 215 1 277 -2 717 -2 427 -3 657 -4 948 -4 217 -10 521 -2 398 -8 380 - 646 -4 384 -1 238 -2 216 -52 203 -19 834 -4 569 -27 816 7 740 Change rate compared to January-September 2015 Exports Imports -15.7 -9.2 -32.5 -8.7 -16.8 -23.0 -14.8 -13.0 -35.1 -13.2 -16.9 -12.8 -3.7 -15.7 -3.0 -3.5 -28.5 -18.1 4.4 -0.6 1.4 -3.0 -7.4 1.9 -3.1 -0.2 -5.6 2.1 -14.9 -12.1 -16.0 -13.5 -15.7 -5.5 -16.8 -16.2 -52.3 -15.2 -15.2 -9.7 -28.0 -11.6 -22.9 -17.0 -6.0 -5.6 -23.6 -19.0 b) Exports, October 2014 – September 2015 Oct-14 5 967 1 000 18 330 6 141 4 302 977 721 876 2 077 425 880 301 36 879 197 75 714 3 255 640 5 552 Nov-14 5 279 927 15 646 5 744 3 795 809 638 738 2 030 423 853 269 32 356 195 54 601 3 045 609 4 262 Dec-14 4 573 921 17 491 7 064 3 768 788 728 829 1 668 403 937 361 34 144 225 72 526 3 149 626 4 548 Jan-15 4 294 794 13 704 5 967 2 875 728 714 697 1 610 424 882 326 26 554 197 52 767 2 756 518 3 213 Feb-15 4 064 706 12 092 5 095 3 128 782 673 746 1 569 478 885 380 29 716 216 53 806 2 581 545 2 673 Mar-15 5 037 791 16 979 5 936 3 402 887 691 820 1 714 526 1 005 446 34 134 258 64 893 2 651 593 3 050 Apr-15 5 279 750 15 156 5 754 3 212 814 732 849 1 531 426 915 219 32 954 226 57 662 2 335 747 4 120 May-15 5 321 796 16 769 5 017 3 359 887 745 826 1 767 496 1 004 369 31 340 223 63 685 2 600 867 3 947 Jun-15 6 266 768 19 628 5 720 3 218 847 649 828 1 635 477 915 362 33 840 218 60 725 2 982 775 3 331 Jul-15 5 894 744 18 533 5 087 3 002 800 800 879 1 533 539 969 310 32 804 213 65 735 2 772 652 3 143 Aug-15 5 545 701 15 485 4 815 2 809 756 658 828 1 543 417 888 263 31 048 185 62 649 2 948 725 2 503 Sep-15 5 611 726 16 148 4 951 2 867 758 584 781 1 371 417 818 232 32 241 168 60 640 2 590 647 2 837 Latin America and the Caribbean 90 666 79 641 84 288 68 619 68 378 81 362 77 910 78 193 84 365 80 593 73 933 75 645 ANC CARICOM CACM MERCOSUR 10 635 1 356 2 855 31 204 9 797 1 369 2 602 26 397 9 506 1 468 2 787 27 763 8 035 1 546 2 609 22 496 7 983 1 192 2 794 20 180 8 558 1 487 3 185 26 551 7 829 1 170 2 657 25 965 8 522 1 111 3 042 27 589 8 603 1 120 2 879 30 725 8 051 1 119 2 896 28 957 8 001 1 104 2 572 24 907 7 554 1 195 2 454 25 884 Argentina Bolivia, P.S. Brazil Chile Colombia Costa Rica Cuba Dominican Republic Ecuador El Salvador Guatemala Honduras Mexico Nicaragua Panama Paraguay Peru Uruguay Venezuela, B.R. TRADE STATISTICS BULLETIN WWW.ECLAC.ORG/COMERCIO 2 c) Imports, October 2014 – September 2015 Argentina Bolivia, P.S. Brazil Chile Colombia Costa Rica Cuba Dominican Republic Ecuador El Salvador Guatemala Honduras Mexico Nicaragua Panama Paraguay Peru Uruguay Venezuela, B.R. Latin America and the Caribbean Oct-14 5 606 994 19 507 5 779 5 847 1 397 635 1 226 2 565 901 1 575 761 36 943 577 1 349 1 090 3 481 1 022 5 311 Nov-14 4 818 827 17 996 5 273 5 354 1 319 705 1 133 2 388 877 1 556 790 33 405 545 1 092 905 3 168 904 4 838 Dec-14 4 499 883 17 198 6 153 5 489 1 306 714 1 145 2 391 829 1 510 771 33 861 539 1 178 975 3 026 844 4 652 Jan-15 4 221 700 16 878 5 045 4 885 1 204 557 1 000 2 210 837 1 359 732 29 816 418 1 019 819 3 288 933 3 386 Feb-15 4 011 722 14 934 4 504 4 587 1 193 622 873 1 878 837 1 294 800 29 124 490 922 771 2 861 769 3 834 Mar-15 4 994 797 16 521 5 141 4 641 1 293 604 1 148 2 019 860 1 532 877 33 664 489 1 030 827 3 306 893 3 485 Apr-15 4 979 710 14 665 4 753 4 461 1 310 599 1 038 1 928 872 1 430 793 33 040 442 871 805 3 130 801 2 932 May-15 4 966 721 14 008 4 263 4 440 1 259 580 1 156 1 749 902 1 544 830 32 357 518 945 748 3 084 709 3 177 Jun-15 5 810 666 15 101 4 937 4 221 1 250 307 1 202 1 754 902 1 439 791 34 589 498 1 009 805 3 195 962 4 183 Jul-15 5 690 795 16 147 5 358 4 968 1 438 585 1 216 1 809 953 1 641 834 35 071 493 1 053 854 3 263 848 3 283 Aug-15 5 495 680 12 796 5 038 4 438 1 285 580 1 185 1 612 817 1 455 714 33 830 481 1 005 818 3 258 679 3 240 Sep-15 5 546 742 13 204 5 068 4 498 1 239 536 1 152 1 739 877 1 536 752 33 661 473 1 061 760 3 216 714 3 515 98 779 90 031 90 153 81 107 76 825 86 188 81 292 79 955 85 489 87 813 80 888 81 644 ANC 12 887 11 738 11 789 11 083 10 047 10 763 10 229 9 994 9 836 10 834 9 988 10 195 CARICOM 2 211 2 136 2 189 1 800 1 797 2 065 1 735 1 999 1 868 1 512 1 481 1 355 CACM 6 561 6 179 6 134 5 570 5 537 6 082 5 717 5 999 5 889 6 414 5 758 5 938 MERCOSUR 32 537 29 461 28 168 26 237 24 319 26 720 24 181 23 607 26 861 26 822 23 028 23 738 Source: ECLAC based on data from Statistical Offices, Central Banks, Export Promotion Agencies, the United States International Trade Commission (USITC), EUROSTAT of the European Union, Statistics Canada, the International Monetary Fund Direction of Trade Statistics (DOTS) and the Central American Monetary Council. Notes: Data for the Bolivarian Republic of Venezuela are estimated based on mirror statistics from its main trading partners and the monthly DOTS trends are applied. Data for Cuba and the CARICOM countries are estimated based on mirror statistics. Data for Honduras and Nicaragua do not include maquila. MERCOSUR data include the Bolivarian Republic of Venezuela and those of CACM include Panama. Figure 1. Latin America and the Caribbean: Trends in Exports, January – September 2015 a) Change compared to previous year (in %) -13.3 Caribbean countries Mexico -14.8 Chile -28.0 MERCOSUR -23.6 South America -23.5 Latin America and the Caribbean -30 Jan-Sep 2015 2.8 -8.8 5.7 Central America -10.7 4.7 Chile -1.1 South America -22.7 0 10 Jan-Sep 2014 2.4 -26.0 -0.8 -22.7 Latin America and the Caribbean -0.7 -10 -5.3 MERCOSUR -5.1 -20 -6.5 -8.3 Andean Community -3.8 1.3 -19.7 Mexico 4.5 -1.0 -15.2 -40 Decomposition of change in price and volume compared to previous year (in %) Caribbean countries -3.9 -3.1 -6.0 Central America Andean Community b) 1.6 -16.7 -30 -20 Price -10 0 10 Volume Source: ECLAC based on data from Statistical Offices, Central Banks, Export Promotion Agencies, USITC, EUROSTAT and DOTS. Notes: Data for the Bolivarian Republic of Venezuela are estimated based on mirror statistics from its main trading partners and the monthly DOTS trends are applied. Data for countries in the Caribbean (Cuba and CARICOM) are estimated based on mirror statistics. The deflators for the Caribbean countries are estimated based on their export structure in 2014. The price index calculated for Mexico takes 2014 as the base year. CACM data do not include Panama; they also do not include maquila for Honduras and Nicaragua. MERCOSUR data include the Bolivarian Republic of Venezuela. TRADE STATISTICS BULLETIN WWW.ECLAC.ORG/COMERCIO 3 Figure 2 and Table 2. Latin America and the Caribbean and Selected Regions: Trends in Value of Exports, January 2006 – September 2015 Latin America and Caribbean Exports: Main Destinations (January 2006 index =100) 1200 1000 800 600 Growth Compared to Other Regions (Accumulated to September each year, in %) Latin America and the Caribbean United States European Union China Other Asia Latin America and the Caribbean Africa and the Middle East Asia China Japan Euro area United States World 400 200 0 Growth J-S 2013 Growth J-S 2014 Growth J-S 2015 -0.1 -2.9 4.9 8.0 -11.7 3.2 0.9 1.8 -0.3 -0.4 3.8 5.1 -3.0 4.4 3.3 2.6 -15.2 -27.2 -4.8 -1.6 -9.1 -14.1 -6.0 -11.9 Source: ECLAC based on data from Statistical Offices, Central Banks, Export Promotion Agencies, USITC, EUROSTAT, Statistics Canada, DOTS, CPB Netherlands Bureau for Economic Policy Analysis and NBS National Bureau of Statistics of China. Notes: Data for the Bolivarian Republic of Venezuela are estimated based on mirror statistics from its main trading partners and the monthly DOTS trends are applied. Data for Cuba and CARICOM are estimated based on mirror statistics. Figure 2 does not include Panama and the Dominican Republic; it does also not include maquila for Honduras and Nicaragua. In the first three quarters of 2015, the main export destinations of Latin America and the Caribbean were the United States (44.3%), Asia (17.6%) and the region itself (17.0%). As regards imports, the United States also were the main source (31.7%), followed by Asia (30.1%) and the region itself (15.9%). The imports coming from China accounted for 17.1% of total imports (see Table 3). It is worth noting the relative recovery of the exports to the United States, which in recent years had represented 40% of the region’s total exports. Table 3. Latin America and the Caribbean: Trade with Main Partners, October 2014 – September 2015 (Millions of current US$) Exports United States European Union Asia China Other Asia Latin America and the Caribbean Rest of the World Var. Share % J-S 15/J-S 14 100.0 -15.2 44.3 -8.8 10.8 -18.9 17.6 -21.5 9.1 -20.2 8.5 -22.8 Oct14 89 715 40 120 9 720 14 112 6 273 7 839 Nov-14 78 850 35 217 8 487 12 507 5 457 7 050 Dec-14 83 386 37 583 8 664 14 376 6 072 8 304 Jan-15 67 870 29 278 7 567 11 700 4 739 6 961 Feb-15 67 580 31 379 7 676 9 985 4 541 5 444 Mar-15 80 478 36 205 8 676 13 453 6 729 6 724 Apr-15 77 004 35 232 8 130 13 422 6 657 6 765 May-15 77 306 33 424 8 370 14 537 8 387 6 149 Jun-15 84 069 36 098 8 902 16 929 9 399 7 530 Jul-15 79 650 34 663 8 996 14 300 7 780 6 521 Aug-15 73 043 32 713 7 609 12 557 6 711 5 846 Sep-15 74 804 33 340 7 883 13 244 7 224 6 032 16 404 14 708 14 578 11 994 11 968 14 159 12 956 13 389 13 688 13 330 12 454 12 108 17.0 -19.9 9 360 7 931 8 185 7 331 6 571 7 985 7 264 7 586 8 452 8 360 7 710 8 227 10.2 -17.1 Imports 96 204 87 806 87 829 79 088 75 029 84 009 79 384 77 855 82 591 85 543 78 698 79 431 100.0 -9.9 United States 30 028 27 846 27 359 24 939 23 531 27 328 25 499 24 908 26 536 26 506 25 013 24 335 31.7 -9.5 European Union 12 725 11 824 12 026 11 063 10 349 8 273 8 124 10 850 11 610 12 203 11 250 10 640 13.1 -15.4 Asia 28 274 25 012 25 001 24 487 22 553 25 039 23 460 23 057 23 534 26 011 23 929 25 139 30.1 -1.2 China 16 582 14 418 14 614 14 216 12 913 14 199 12 832 12 835 13 435 14 339 13 877 14 686 17.1 -2.0 Other Asia 11 693 10 594 10 387 10 271 9 640 10 840 10 628 10 222 10 099 11 672 10 052 10 465 13.0 -0.1 Latin America and 16 520 15 133 15 214 12 235 12 326 13 724 12 860 12 630 13 542 13 373 12 178 12 028 15.9 -19.2 the Caribbean Rest of the World 8 656 7 991 8 229 6 365 6 270 9 644 9 440 6 409 7 370 7 451 6 328 7 288 9.2 -10.6 Source: ECLAC based on data from Statistical Offices, Central Banks, Export Promotion Agencies, USITC, EUROSTAT, Statistics Canada and DOTS. Notes: Includes data from Argentina, the Plurinational State of Bolivia, Brazil, Chile, Colombia, Costa Rica, Cuba, Ecuador, El Salvador, Guatemala, Honduras, Mexico, Nicaragua, Paraguay, Peru, Uruguay, the Bolivarian Republic of Venezuela and CARICOM. It does not include maquila for Honduras and Nicaragua. Data for Cuba and CARICOM are estimated based on mirror statistics of the United States, the European Union, Canada and the rest of Latin America. In the case of the Bolivarian Republic of Venezuela, the total was disaggregated utilizing mirror statistics from the United States, the European Union, Japan, Chile, the rest of the MERCOSUR countries, the Andean Community, Mexico, Costa Rica, Guatemala and Nicaragua; DOTS structure was used for the rest of the destinations. In the first nine months of 2015, the exports to China and the European Union decreased by 20% and 19%, respectively, compared to the same period in 2014. In terms of imports, the largest declines were registered in those TRADE STATISTICS BULLETIN WWW.ECLAC.ORG/COMERCIO 4 coming from the region itself (-19.2%) and from the European Union (-15.4%). It is noteworthy that both exports and imports by trade partner generally showed negative trends, with the smallest drops in purchases from Asia. Up to September 2015, the largest share of intra-regional trade was observed in the Central American Common Market (25.8%), the only sub-region whose coefficient lay above the aggregated one for whole Latin America and the Caribbean (17.0%). The Andean Community (CAN) remains the grouping with the lowest coefficient of intrasubregional trade (8.0%). The positive growth rate of intra-regional trade in the Central American Common Market should be highlighted. This contrasts the general decrease in trade in the other subregions, including the exports of Chile and Mexico to the region (see Table 4). Table 4. Latin America: Intra-Subregional and Intra-Regional Trade, October 2014 – September 2015 (Percentages of total exports and growth rates) Oct-14 Nov-14 Dec-14 Jan-15 Feb-15 Mar-15 Apr-15 May-15 Jun-15 Intra CAN 7.9 7.6 7.9 7.2 8.3 7.2 8.6 9.2 8.2 Intra CACM 26.1 26.8 23.7 25.2 24.0 23.5 26.2 24.5 25.6 Intra MERCOSUR 14.6 15.8 14.0 12.6 14.5 15.8 15.3 15.6 14.2 Chile to LAC 22.4 21.3 16.8 16.5 17.5 18.3 19.7 18.1 16.2 Mexico to LAC 6.2 6.0 5.8 6.0 5.9 6.0 6.2 6.1 6.1 Intra LAC 18.3 18.7 17.5 17.7 17.7 17.6 16.8 17.3 16.3 Intra LAC w/o Mexico 26.7 27.5 25.6 25.2 27.0 26.2 24.8 25.0 23.1 Source: ECLAC based on data from Statistical Offices, Central Banks, Export Promotion Agencies, USITC, EUROSTAT and DOTS. Note: It does not include maquila for Honduras and Nicaragua. MERCOSUR data include the Bolivarian Republic of Venezuela. a Growth rates with respect to the same period of the previous year. Jul-15 7.7 27.1 14.4 21.3 6.3 16.7 24.1 Aug-15 8.1 27.3 17.4 20.3 5.8 17.0 25.4 Var. a Sep-15 J-S 15/J-S 14 7.7 -21.4 28.5 2.,0 16.2 -17.7 19.5 -13.7 5.6 -10.5 16.2 -19.9 24.2 -21.3 B – Trade by Category and Main Products Table 5. Latin America and the Caribbean: Main Traded Product Categories, October 2014 – September 2015 (Millions of current US$) Oct-14 EXPORTS 88 809 Agriculture and Livestock 11 168 Mining and Petroleum 23 064 Manufactures 54 577 Nov-14 77 996 9 812 20 468 47 716 Dec-14 78 008 10 927 21 091 45 990 Jan-15 65 706 11 063 17 440 37 203 Feb-15 62 629 9 323 14 995 38 310 Mar-15 79 268 11 322 16 061 51 885 Apr-15 76 174 10 191 16 374 49 609 May-15 76 387 10 785 16 912 48 689 Jun-15 83 182 10 832 18 441 53 909 Jul-15 78 777 10 562 15 514 52 702 Aug-15 70 783 9 515 14 238 47 030 Sep-15 74 547 10 190 14 384 49 973 Var. Share % J-S 15/J-S 14 100.0 -15.2 13.8 -5.4 22.9 -38.2 63.3 -6.7 IMPORTS 95 880 87 046 87 210 80 809 76 112 83 491 79 962 79 575 85 078 88 445 82 087 81 946 100.0 -9.7 Capital Goods 16 986 15 934 16 232 15 416 13 103 14 861 14 285 13 270 14 298 15 165 13 727 14 133 17.6 -6.6 Intermediate Inputs 48 490 42 610 42 901 42 009 40 638 44 139 42 769 43 475 46 053 47 626 43 659 44 407 52.5 -0.4 Consumption Goods 18 892 17 382 16 796 14 850 14 182 16 195 14 826 14 760 15 452 16 356 16 415 15 921 19.1 -6.2 Fuels 11 512 11 121 11 281 8 534 8 189 8 296 8 083 8 070 9 274 9 298 8 287 7 485 10.9 -33.0 Source: ECLAC based on data from Statistical Offices, Central Banks, Export Promotion Agencies, USITC and EUROSTAT. Note: Includes data from Argentina, the Plurinational State of Bolivia, Brazil, Chile, Colombia, Costa Rica, Ecuador, El Salvador, Guatemala, Honduras, Mexico, Nicaragua, Panama, Paraguay, Peru, the Dominican Republic, Uruguay and the Bolivarian Republic of Venezuela. It does not include maquila for Honduras and Nicaragua. Data for the Bolivarian Republic of Venezuela are estimated based on mirror statistics from its main trading partners that were assumed to have repeating shares in the same category in the same month of the previous year and the monthly DOTS trends are applied. By product categories, the largest changes in the first three quarters of 2015 with respect to the previous year were registered in the exports of mining and petroleum (-38.2%) and manufactured goods that alone accounted for 64% of total exports in this period and whose exports dropped 6.7%. Meanwhile, the exports of agricultural and livestock products experienced a decrease of 5.4%. The decline in export value can be mainly explained by the change in oil, copper and gas prices, which together represent about a third of the total exports. Likewise, the Latin American commodities price index fell by 29.7% (see Table 6.b), with sharp declines in all products (oil, iron, gas, soy, sugar) except banana. In terms of export volume, all products registered increases, above all iron, soy beverages, soy and sugar (see Table 6a). TRADE STATISTICS BULLETIN WWW.ECLAC.ORG/COMERCIO 5 Table 6. Latin America and the Caribbean: Main Products Exported, January – September 2015 (Millions of current US$, percentages and price indices 2010=100) a) Selected Products b) Product Groups Value Prices Volume Prices Jan-Sep Jan-Sep Value Sep Jan-Sep Jan-Sep Price change Jan-Sep Jan-Sep Price Sep (E) 2014 2015 change 2015 2014 2015 change 2014 2015 change 2015 Sugar 2% 9 160 8 248 -9.9 55.7 81.3 61.7 -24.1 14.2 Foodstuff 10% 107.3 91.5 -14.6 85.9 Banana 1% 3 269 3 424 4.8 108.0 106.5 109.8 3.1 1.7 Beverages 3% 97.8 79.9 -18.3 71.3 Beverages (A) 2% 7 273 7 265 -0.1 71.3 97.8 79.9 -18.3 18.2 Oils and 8% 116.7 89.5 -23.3 83.6 Meats 7% 19 121 19 062 -0.3 132.6 139.8 136.7 -2.3 2.0 flours Copper 8% 36 882 31 124 -15.6 69.1 92.1 75.7 -17.8 2.2 Other agro 9% 94.2 89.3 -5.2 85.8 Gas 1% 5 724 3 540 -38.2 60.3 104.2 63.5 -39.1 0.9 Minerals and 27% 87.5 67.8 -22.5 63.0 Iron-Steel (B) 3% 11 851 10 573 -10.8 45.8 82.9 47.7 -42.4 31.6 metals Oil 21% 119 425 67 577 -43.4 58.5 130.8 67.8 -48.2 4.7 Fuels 45% 126.8 72.5 -42.8 64.5 Soy (C) 3% 27 069 26 854 -0.8 81.8 113.2 88.2 -22.1 21.3 Sub-total 47% 239 773 177 667 -25.9 73.4 117.2 80.4 -31.4 5.5 Total 100% 107.9 75.8 -29.7 69.6 Source: ECLAC based on data from Statistical Offices, Central Banks, Export Promotion Agencies, CEPALSTAT and the World Bank. See description in the Annex in Excel. Notes: Product statistics are made up by main exporters in the region and not with all countries; in each case, they represent more than 70% of the annual total in that product. In the case of prices, it is an index calculated by ECLAC. (A) Average of coffee, tea and yerba mate; (B) Made up of iron and steel manufactures; (C) Soy grains; (D) Weight of each product in the total regional exports; (E) Weight of each group in natural resources and manufacturing exports in the region. Products (D) Recent Activities of the International Trade and Integration Division Publications Relaciones comerciales y de inversión entre la Comunidad de Estados Latinoamericanos y Caribeños (CELAC) y sus socios extrarregionales estratégicos (Nov 2015) Latin America and the Caribbean in the World Economy 2015. The regional trade crisis: assessment and outlook (Oct 2015) Sostenibilidad ambiental y competitividad internacional: la huella de carbono de las exportaciones de alimentos (Sep 2015) Globalización, integración y comercio inclusivo en América Latina: Textos seleccionados 2010-2014 (Sep 2015) Rising concentration in Asia-Latin American value chains: Can small firms turn the tide? (Jun 2015) Latin America and the Caribbean and China: towards a new era in economic cooperation (May 2015) Economic relations between Latin America and the Caribbean and the Republic of Korea: Advances and opportunities (Apr 2015) La participación de América Latina y el Caribe en el Mecanismo de Solución de Diferencias de la OMC: una mirada panorámica a los primeros 20 años (Feb 2015) First Forum of China and the Community of Latin American and Caribbean States (CELAC): Exploring opportunities for cooperation on trade and investment (Jan 2015) La Alianza del Pacífico y el MERCOSUR: hacia la convergencia en la diversidad (Nov 2014) Aid for Trade indicators Dashboard: user manual (Oct 2014) Latin America and the Caribbean in the World Economy 2014: Regional integration and value chains in a challenging external environment (Oct 2014) Oportunidades para el aprovechamiento del protocolo comercial entre Guatemala y Chile (Oct 2014) Informe del quinto seminario internacional sobre la huella de carbono “Prácticas públicas y privadas para reducir las huellas ambientales en el comercio internacional”: CEPAL,13 y 14 de junio de 2013 (Sep 2014) The Panama Canal expansion: A driver of change for global trade flows (Aug2014) Events Política Comercial y Evaluación de Efectos Sociales: Metodología y Estudios de Caso (11 Feb 2016, Colombia) Seminario: Innovación para pymes exportadoras (20-21 Jan 2016, Chile) Política Comercial y Evaluación de Efectos Sociales: Metodología y Estudios de Caso (15 Dec 2015, Ecuador) Séptimo seminario internacional CEPAL sobre la huella ambiental, sostenibilidad del comercio internacional y estándares ambientales (14-15 Dec 2015, Chile) Seminario: Innovación para exportar y su financiamiento en el Salvador (7 Sep 2015, El Salvador) Taller: Microdatos y tecnología (18 Aug 2015, Chile) Reunión Regional sobre Sistemas de Compras Públicas en América Latina y El Caribe (15-16 Jul 2015, Ecuador) Quinto Foro internacional de servicios Promperú (8 Jul 2015, Peru) Taller Regional: Capacitación en Inteligencia de Negocios (BI) aplicada a Riesgo y Valoración Aduanera y Modelo de Datos de la OMA (16-17 Jun, Costa Rica) Taller: Estudio de Encadenamiento Productivos en Sudamérica: aproximación a una Matriz de Insumo – Producto Regional (3-4 Jun 2015, Chile) Seminar: Expanding the role of SMEs in value chains between Asia and Latin America (29 Apr 2015, Chile) Taller: Innovación para exportar: Alimentos nostálgicos de El Salvador (23-24 Apr 2015, El Salvador) Seminario-Taller Internacional de PYME: Requisitos de Acceso al mercado de Estados Unidos (22 Apr 2015, Nicaragua) Meeting: Latin America's Prospects for Upgrading in Global Value Chains (14-15 Mar, Mexico) This document, which has not been submitted to formal editing, was prepared by the International Trade and Integration Division at the Economic Commission for Latin America and the Caribbean (ECLAC). Copyright © United Nations, 2016. All rights reserved. TRADE STATISTICS BULLETIN WWW.ECLAC.ORG/COMERCIO 6
