bulletin_fourth_quarter_2014_no17 PDF | 956.5 Kb
Anuncio
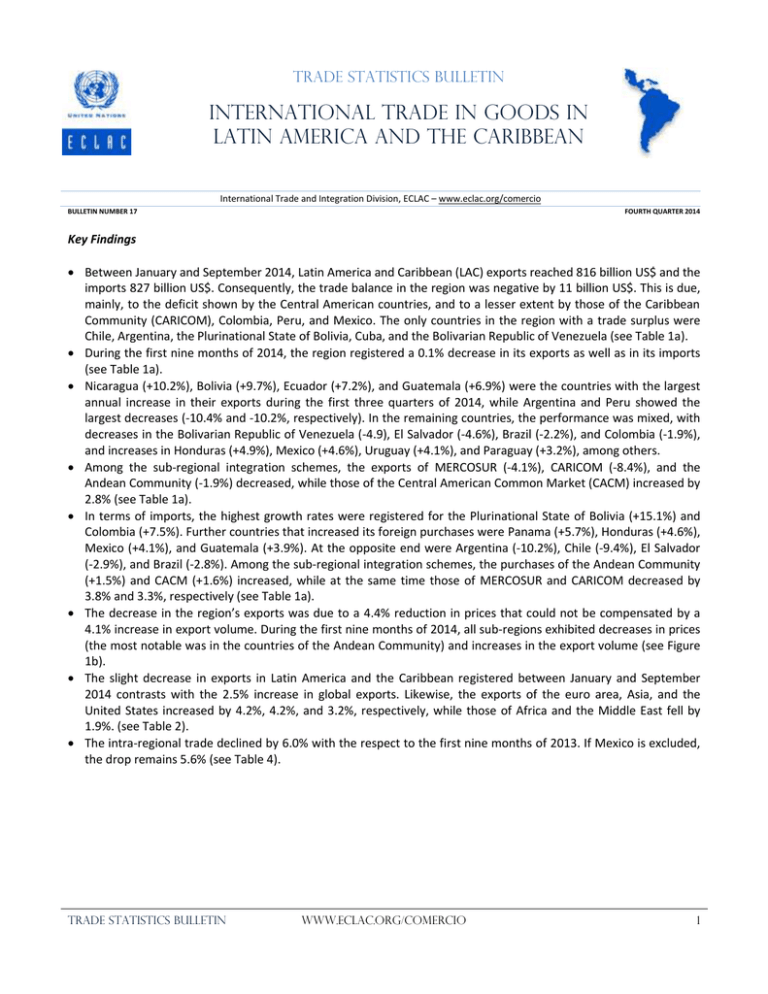
Trade Statistics Bulletin International Trade in Goods in Latin America and the Caribbean International Trade and Integration Division, ECLAC – www.eclac.org/comercio BULLETIN NUMBER 17 FOURTH QUARTER 2014 Key Findings Between January and September 2014, Latin America and Caribbean (LAC) exports reached 816 billion US$ and the imports 827 billion US$. Consequently, the trade balance in the region was negative by 11 billion US$. This is due, mainly, to the deficit shown by the Central American countries, and to a lesser extent by those of the Caribbean Community (CARICOM), Colombia, Peru, and Mexico. The only countries in the region with a trade surplus were Chile, Argentina, the Plurinational State of Bolivia, Cuba, and the Bolivarian Republic of Venezuela (see Table 1a). During the first nine months of 2014, the region registered a 0.1% decrease in its exports as well as in its imports (see Table 1a). Nicaragua (+10.2%), Bolivia (+9.7%), Ecuador (+7.2%), and Guatemala (+6.9%) were the countries with the largest annual increase in their exports during the first three quarters of 2014, while Argentina and Peru showed the largest decreases (-10.4% and -10.2%, respectively). In the remaining countries, the performance was mixed, with decreases in the Bolivarian Republic of Venezuela (-4.9), El Salvador (-4.6%), Brazil (-2.2%), and Colombia (-1.9%), and increases in Honduras (+4.9%), Mexico (+4.6%), Uruguay (+4.1%), and Paraguay (+3.2%), among others. Among the sub-regional integration schemes, the exports of MERCOSUR (-4.1%), CARICOM (-8.4%), and the Andean Community (-1.9%) decreased, while those of the Central American Common Market (CACM) increased by 2.8% (see Table 1a). In terms of imports, the highest growth rates were registered for the Plurinational State of Bolivia (+15.1%) and Colombia (+7.5%). Further countries that increased its foreign purchases were Panama (+5.7%), Honduras (+4.6%), Mexico (+4.1%), and Guatemala (+3.9%). At the opposite end were Argentina (-10.2%), Chile (-9.4%), El Salvador (-2.9%), and Brazil (-2.8%). Among the sub-regional integration schemes, the purchases of the Andean Community (+1.5%) and CACM (+1.6%) increased, while at the same time those of MERCOSUR and CARICOM decreased by 3.8% and 3.3%, respectively (see Table 1a). The decrease in the region’s exports was due to a 4.4% reduction in prices that could not be compensated by a 4.1% increase in export volume. During the first nine months of 2014, all sub-regions exhibited decreases in prices (the most notable was in the countries of the Andean Community) and increases in the export volume (see Figure 1b). The slight decrease in exports in Latin America and the Caribbean registered between January and September 2014 contrasts with the 2.5% increase in global exports. Likewise, the exports of the euro area, Asia, and the United States increased by 4.2%, 4.2%, and 3.2%, respectively, while those of Africa and the Middle East fell by 1.9%. (see Table 2). The intra-regional trade declined by 6.0% with the respect to the first nine months of 2013. If Mexico is excluded, the drop remains 5.6% (see Table 4). TRADE Statistics BULLETIN www.eclac.org/comercio 1 A – Trade by Origin and Destination Table 1. Latin America and the Caribbean: Trends in Goods Exports. (Millions of current US$ and growth rates in percentages) a) Accumulated January - September Argentina Bolivia, Plurinational State of Brazil Chile Colombia Costa Rica Cuba Dominican Republic Ecuador El Salvador Guatemala Honduras Mexico Nicaragua Panama Paraguay Peru Uruguay Venezuela, Bolivarian Republic of Latin America and the Caribbean Andean Community (ANC) Caribbean Community (CARICOM) Central American Common Market (CACM) Southern Common Market (MERCOSUR) January - September 2014 Exports Import 56 116 50 326 10 043 7 130 173 635 174 330 56 726 50 703 42 931 47 370 8 730 13 164 6 557 5 773 7 476 10 399 19 957 20 395 4 022 7 905 8 163 13 635 3 138 6 989 294 006 295 768 2 017 4 216 630 10 141 7 815 8 329 28 712 30 262 7 293 8 714 63 615 43 074 815 916 827 433 101 643 105 156 14 333 18 810 26 701 56 050 308 474 284 775 Growth rate Balance 5 790 2 913 - 696 6 024 -4 440 -4 434 783 -2 923 - 438 -3 883 -5 472 -3 850 -1 762 -2 198 -9 511 - 514 -1 549 -1 422 20 541 -11 517 -3 513 -4 477 -29 349 23 700 Exports Imports -10.2 15.1 -2.8 -9.4 7.5 -2.1 -11.4 3.0 -1.1 -2.9 3.9 4.6 4.1 1.0 5.7 -1.3 -7.4 1.2 -1.3 -0.4 1.5 -3.3 1.6 -3.8 -10.4 9.7 -2.2 -1.1 -1.9 0.6 -0.5 3.7 7.2 -4.6 6.9 4.9 4.6 10.2 -1.2 3.2 -7.9 4.1 -4.9 -0.3 -1.0 -8.4 2.8 -4.1 b) Exports, October 2013 - September 2014 Argentina Bolivia, P.S. Brazil Chile Colombia Costa Rica Cuba Dominican Republic Ecuador El Salvador Guatemala Honduras Mexico Nicaragua Panama Paraguay Peru Uruguay Venezuela, B.R. Latin America and the Caribbean ANC CARICOM CACM MERCOSUR Oct-13 7 144 1 110 22 821 7 025 4 838 1 006 767 833 2 124 450 768 270 35 082 202 76 658 3 511 673 7 611 Nov-13 6 609 966 20 861 6 115 4 946 981 797 749 2 025 400 804 289 31 679 190 70 661 3 217 653 7 216 Dec-13 5 267 975 20 846 6 208 5 272 880 690 710 2 186 425 826 336 32 067 179 60 538 3 612 733 7 160 Jan-14 5 231 1 013 16 026 5 504 4 809 857 808 740 2 016 403 835 341 27 052 222 59 734 3 062 594 8 644 Feb-14 5 393 1 024 15 934 6 227 4 271 967 667 790 2 168 412 806 328 30 462 205 61 864 3 226 481 6 904 Mar-14 5 253 1 145 17 628 7 308 4 408 1 043 700 873 2 452 474 1 035 359 33 236 261 71 951 3 169 705 7 511 Apr-14 6 398 1 054 19 724 6 640 4 317 984 721 818 1 884 422 940 362 34 071 217 65 1 091 3 027 738 7 011 May-14 7 117 1 204 20 752 6 891 5 496 1 065 766 907 2 604 488 947 412 34 383 232 68 982 3 024 1 094 7 216 Jun-14 7 387 1 162 20 467 6 097 4 698 987 714 801 2 303 469 892 362 33 474 238 86 889 3 142 1 086 6 813 Jul-14 6 723 1 188 23 024 6 333 5 049 950 714 863 2 138 486 949 390 33 711 218 76 763 3 272 1 052 6 585 Aug-14 6 599 1 144 20 463 5 918 4 813 957 732 845 2 288 434 874 303 33 361 218 73 793 3 518 820 6 495 Sep-14 6 016 1 109 19 617 5 810 5 069 919 734 839 2 104 434 885 281 34 256 207 72 749 3 273 722 6 436 98 499 11 583 1 529 2 772 38 907 90 709 11 154 1 481 2 734 36 001 90 490 12 045 1 521 2 705 34 544 80 301 10 900 1 351 2 717 31 229 82 661 10 689 1 472 2 779 29 576 90 373 11 174 1 792 3 242 32 048 92 299 10 282 1 814 2 991 34 962 97 284 12 328 1 637 3 212 37 161 93 532 11 305 1 465 3 033 36 641 96 253 11 647 1 769 3 069 38 147 92 289 11 763 1 640 2 859 35 170 90 924 11 555 1 392 2 797 33 540 TRADE Statistics BULLETIN www.eclac.org/comercio 2 c) Imports, October 2013 - September 2014 Argentina Bolivia, P.S. Brazil Chile Colombia Costa Rica Cuba Dominican Republic Ecuador El Salvador Guatemala Honduras Mexico Nicaragua Panama Paraguay Peru Uruguay Venezuela, B.R. Oct-13 6 550 833 23 051 6 695 5 348 1 610 753 1 288 2 454 942 1 605 798 35 217 488 1 297 991 3 904 1 105 5 111 Nov-13 5 912 779 19 122 5 674 5 033 1 533 707 1 148 2 207 895 1 443 807 31 364 463 1 102 922 3 469 982 4 861 Dec-13 5 160 938 18 195 6 207 4 935 1 431 795 1 173 2 023 796 1 333 763 30 441 500 1 041 952 3 242 941 4 428 Jan-14 5 196 779 20 085 6 080 4 844 1 520 646 1 041 2 337 905 1 548 680 30 234 473 1 076 868 3 536 1 079 5 279 Feb-14 5 349 764 18 063 5 299 5 003 1 375 654 944 1 972 814 1 356 699 29 543 409 1 033 855 2 910 825 4 328 Mar-14 5 211 689 17 515 5 544 4 912 1 624 703 1 189 2 168 896 1 475 791 32 287 447 1 061 865 3 316 1 127 4 821 Apr-14 5 472 749 19 218 5 807 5 455 1 491 637 1 268 2 211 904 1 521 771 33 562 446 1 221 896 3 511 822 4 514 May-14 5 858 738 20 037 5 440 5 423 1 553 620 1 270 2 447 973 1 668 872 34 251 493 1 123 915 3 419 1 051 4 859 Jun-14 6 008 724 18 105 5 527 4 955 1 360 605 1 160 2 243 879 1 443 788 33 051 496 1 170 888 3 230 1 024 4 828 Jul-14 5 920 915 21 450 5 943 6 084 1 400 613 1 212 2 338 926 1 620 793 34 691 499 1 069 1 044 3 520 947 4 813 Aug-14 5 700 883 19 300 5 642 4 902 1 435 641 1 201 2 389 776 1 462 812 34 484 503 1 072 1 002 3 502 850 4 811 Sep-14 5 612 889 20 556 5 420 5 791 1 404 654 1 115 2 290 833 1 541 782 33 666 448 1 316 999 3 318 990 4 821 Latin America and the Caribbean 102 180 90 590 87 656 90 319 84 063 88 940 92 443 94 912 90 697 98 059 93 401 94 601 ANC 12 539 11 488 11 138 11 497 10 649 11 086 11 927 12 027 11 151 12 856 11 675 12 288 CARICOM 2 140 2 167 2 361 2 113 1 868 2 297 1 965 1 901 2 215 2 262 2 034 2 155 CACM 6 740 6 243 5 865 6 202 5 687 6 295 6 355 6 682 6 136 6 308 6 060 6 325 MERCOSUR 36 808 31 799 29 676 32 506 29 420 29 539 30 922 32 720 30 852 34 174 31 663 32 978 Source: ECLAC based on data from Statistical Offices, Central Banks, Export Promotion Agencies, the United States International Trade Commission (USITC), EUROSTAT of the European Union, Statistics Canada, the International Monetary Fund Direction of Trade Statistics (DOTS), and the Central American Monetary Council. Notes: Data for the Bolivarian Republic of Venezuela beginning in October 2013 are estimated based on mirror statistics from its main trading partners; for the period JulySeptember 2014, the monthly DOTS trends are applied. Data for Cuba and the CARICOM countries are estimated based on mirror statistics. Data for Honduras and Nicaragua do not include maquila. Data for the Dominican Republic for July-September 2014 are estimated. MERCOSUR data include the Bolivarian Republic of Venezuela and those of CACM include Panama. Figure 1. Latin America and the Caribbean: Trends in Exports, January - September 2014 a) Change compared to previous year 2,9 Caribbean Countries 4,4 1,8 -1,1 Central America Andean Community -1,0 -3,1 -1,6 -0,3 -0,1 Latin America and the Caribbean -6 -4 Jan-Sep 2014 -2 0 2 4 -3,6 8,0 -4,4 Latin America and the Caribbean -4,4 -20 -10 Price Jan-Sep 2013 1,3 6,1 -3,8 -0,3 South America 6 4,9 -10,0 MERCOSUR -1,5 1,1 -2,3 Andean Community 0,3 1,8 -6,0 Chile -2,9 -3,9 South America Mexico Central America 0,8 MERCOSUR -4,1 Decomposition of growth in price and volume compared to previous year Caribbean Countries -2,2 Mexico Chile b) 1,3 4,1 0 10 20 Volume Source: ECLAC based on data from Statistical Offices, Central Banks, Export Promotion Agencies, USITC, EUROSTAT, and DOTS. Notes: Data for the Bolivarian Republic of Venezuela beginning in October 2013 are estimated based on mirror statistics from its main trading partners; for the period JulySeptember 2014, the monthly DOTS trends are applied. Data for countries in the Caribbean (Cuba and CARICOM) are estimated based on mirror statistics. Cuba’s deflator is built based on the volume imported by the European Union; the Caribbean’s deflator is built based on the deflators reported by Guyana and Jamaica to the IMF. CACM data do not include Panama; they also do not include maquila for Honduras and Nicaragua. MERCOSUR data include the Bolivarian Republic of Venezuela. During the first nine months of 2014, the exports in the region fell by 0.3% as a result of a 4.4% drop in prices that could not be offset by a 4.1% increase in export volume. All the sub-regions registered decreases in prices (with the most notable in the countries of the Andean Community) and increases in the export volume (see Figure 1b). TRADE Statistics BULLETIN www.eclac.org/comercio 3 Figure 2 and Table 2. Latin America and the Caribbean and Selected Regions: Trends in Value of Exports, January 2006 - September 2014 Latin America and Caribbean Exports: Main Destinations (January index 2006=100) 1200 1000 800 600 Growth Compared to Other Regions (Accumulated to September of each year, in percentages) United States European Union China Other Asia Latin America and the Caribbean Latin America and the Caribbean Africa and the Middle East Asia China Japan Euro area United States World 400 200 0 Growth J-S 2012 Growth J-S 2013 Growth J-S 2014 1.3 2.1 2.4 7.4 -0.8 -5.3 5.6 -0.4 -0.1 -2.8 5.7 8.0 -11.4 2.5 1.4 1.8 -0.3 -1.9 4.2 2.1 -2.8 4.2 3.2 2.5 Source: ECLAC based on data from Statistical Offices, Central Banks, Export Promotion Agencies, USITC, EUROSTAT, Statistics Canada, DOTS, and CPB Netherlands Bureau for Economic Policy Analysis. Notes: Data for the Bolivarian Republic of Venezuela beginning in October 2013 are estimated based on mirror statistics from its main trading partners; for the period JulySeptember 2014, the monthly DOTS trends are applied. Data for Cuba and CARICOM are estimated based on mirror statistics. Figure 2 does not include Panama and the Dominican Republic; it does also not include maquila for Honduras and Nicaragua. In the period January-September 2014, the main export destinations of Latin America and the Caribbean were the United States (40.8%), Asia (19.0%), and the region itself (17.8%). As regards imports, the United States also were the main source (31.1%), followed by Asia (27.1%) and the region itself (18.1%) (see Table 3). Table 3. Latin America and the Caribbean: Trade with Main Partners, October 2013 - September 2014 (Millions of current US$) Exports United States European Union Asia China Other Asia Latin America and the Caribbean Rest of the World Oct-13 97 589 39 734 12 484 17 679 8 653 9 026 18 323 9 368 Nov-13 89 889 35 209 9 807 16 245 8 554 7 691 19 043 9 585 Dec-13 89 720 36 380 9 673 16 867 8 444 8 422 16 785 10 016 Jan-14 79 502 32 630 8 807 14 600 7 280 7 320 14 901 8 564 Feb-14 81 810 34 493 9 062 14 759 7 181 7 578 14 970 8 528 Mar-14 89 430 36 881 9 526 17 452 8 790 8 662 16 572 8 999 Apr-14 91 416 37 812 10 515 16 558 9 017 7 541 15 628 10 903 May-14 96 309 38 292 11 711 18 525 9 742 8 783 17 281 10 499 Jun-14 92 645 37 188 10 927 17 817 9 262 8 555 15 741 10 972 Jul-14 95 314 39 094 10 605 17 278 7 995 9 283 17 025 11 312 Aug-14 91 371 37 437 10 483 16 523 8 326 8 196 16 157 10 771 Sep-14 Share % 90 013 100.0 38 033 40.8 9 842 11.3 15 901 19.0 7 558 9.7 8 343 9.3 16 158 17.8 10 079 11.1 Imports 99 595 88 341 85 442 88 202 82 087 86 690 89 954 92 519 88 366 95 778 91 128 92 169 100.0 United States 29 501 27 054 26 570 26 510 25 426 27 750 27 250 28 271 27 298 28 477 28 189 28 409 31.1 European Union 13 715 12 981 11 873 12 000 10 862 12 279 12 978 12 289 11 704 13 417 12 662 12 259 13.7 Asia 28 172 23 793 23 080 24 651 21 219 21 522 23 161 24 209 21 721 26 030 25 572 26 033 27.1 China 16 428 13 625 13 260 14 069 11 757 11 495 12 578 13 504 12 263 15 271 15 046 15 090 15.6 Other Asia 11 625 10 088 9 692 10 519 9 414 9 972 10 545 10 652 9 382 10 748 10 422 10 770 11.5 Latin America and the Caribbean 18 224 16 249 15 641 15 556 15 057 16 039 16 196 16 972 15 363 16 993 15 269 15 557 18.1 Rest of the World 9 983 8 264 8 277 9 485 9 522 9 101 10 369 10 777 12 279 10 861 9 436 9 911 10.0 Source: ECLAC based on data from Statistical Offices, Central Banks, Export Promotion Agencies, USITC, EUROSTAT, Statistics Canada, and DOTS. Notes: Includes data from Argentina, the Plurinational State of Bolivia, Brazil, Chile, Colombia, Costa Rica, Cuba, Ecuador, El Salvador, Guatemala, Honduras, Mexico, Nicaragua, Paraguay, Peru, Uruguay, the Bolivarian Republic of Venezuela, and CARICOM. It does not include maquila for Honduras and Nicaragua. Data for Cuba and CARICOM are estimated based on mirror statistics of the United States, the European Union, Canada, and the rest of Latin America. In the case of the Bolivarian Republic of Venezuela, the total was disaggregated utilizing mirror statistics from the United States, the European Union, Japan, Chile, the rest of the MERCOSUR countries, the Andean Community, Mexico, Costa Rica, Guatemala, and Nicaragua; DOTS structure was used for the rest of the destinations. With respect to the first nine month of 2014, the regional exports to the European Union decreased by 2.9%, while those to the United States increased by 3.7%. The sales to Asia fell by 1.6% and those to the own region also dropped by 5.9%. In the case of imports, the most dynamic ones were those coming from the United States (+3.1%) and Asia (+1.7%), particularly from China (+4.8%). TRADE Statistics BULLETIN www.eclac.org/comercio 4 Table 4. Latin America: Intra-Subregional and Intra-Regional Trade, October 2013 - September 2014 (Percentages of total exports and growth rates) Oct-13 Nov-13 Dec-13 Jan-14 Feb-14 Mar-14 Apr-14 May-14 Jun-14 Intra CAN 7.7 6.9 6.5 6.8 7.2 8.5 7.1 7.2 7.0 Intra CACM 23.0 23.9 21.4 23.9 23.5 23.2 22.9 22.9 24.1 Intra MERCOSUR 14.9 15.9 14.1 14.0 14.7 13.7 12.2 13.0 12.1 Chile to LAC 19.6 21.2 17.8 17.0 18.1 16.9 17.7 18.9 18.8 Mexico to LAC 7.1 6.8 5.8 6.0 6.2 6.8 6.5 6.9 6.4 Intra LAC 18.8 21.2 18.7 18.7 18.3 18.5 17.1 17.9 17.0 Intra LAC w/o Mexico 25.3 29.0 25.9 25.3 25.5 25.5 23.4 24.1 23.0 Source: ECLAC based on data from Statistical Offices, Central Banks, Export Promotion Agencies, USITC, EUROSTAT, and DOTS. Note: It does not include maquila for Honduras and Nicaragua. MERCOSUR data include the Bolivarian Republic of Venezuela. a Growth rates with respect to the same period of the previous year. Jul-14 6.7 24.0 12.2 18.6 6.6 17.9 24.0 Aug-14 7.8 24.6 12.6 19.6 6.4 17.7 24.2 Growth a Sep-14 J-S 14/J-S 13 7.6 -1.7 24.5 14.2 13.9 -10.4 20.2 -3.3 6.4 -8.6 18.0 -6.0 25.0 -5.6 Through September 2014, the largest share of intra-regional trade was observed in the Central American Common Market (24.5%), the only sub-region whose coefficient lay above the aggregated one for whole Latin America and the Caribbean (18.0%). The Andean Community (CAN) remains the grouping with the lowest coefficient of intrasubregional trade (7.6%). Moreover, the negative growth recorded for the exports of Mexico and Chile to the region (-8.6% and -3.3%, respectively) and for the intra-MERCOSUR (-10.4%) and intra-CAN trade (-1.7%) should be highlighted (see Table 4). B – Trade by Category and Main Products Table 5. Latin America and the Caribbean: Main Traded Product Categories, October 2013 - September 2014 (Millions of current US$) EXPORTS Agriculture and Livestock Mining and Petroleum Manufactures Oct-13 96 059 10 476 28 484 57 099 Nov-13 88 398 9 961 26 686 51 751 Dec-13 88 114 10 080 28 688 49 347 Jan-14 79 014 10 153 26 379 42 482 Feb-14 80 636 9 395 25 481 45 760 Mar-14 87 999 10 274 26 512 51 212 Apr-14 90 033 11 488 24 850 53 695 May-14 94 889 11 936 27 841 55 112 Jun-14 91 818 11 552 26 832 53 434 Jul-14 94 271 11 570 27 175 55 525 Aug-14 88 846 10 964 25 411 52 471 Sep-14 88 936 10 011 25 686 53 240 Share % 100.0 12.3 29.5 58.2 IMPORTS 99 756 88 079 84 865 88 124 82 057 86 520 90 703 92 840 88 099 95 672 89 272 90 759 100.0 Capital Goods 18 091 16 775 16 858 16 895 14 623 15 244 15 913 15 917 15 042 16 675 15 092 15 733 17.6 Intermediate Inputs 48 655 42 814 40 061 41 496 40 031 43 407 44 338 47 512 43 838 47 735 46 318 45 594 49.7 Consumption Goods 20 174 17 585 16 800 16 779 15 547 16 001 17 065 16 929 16 101 17 524 16 545 17 472 18.7 Fuels 12 836 10 906 11 147 12 954 11 856 11 869 13 388 12 483 13 119 13 738 11 317 11 960 14.0 Source: ECLAC based on data from Statistical Offices, Central Banks, Export Promotion Agencies, USITC, and EUROSTAT. Note: Includes data from Argentina, the Plurinational State of Bolivia, Brazil, Chile, Colombia, Costa Rica, Ecuador, El Salvador, Guatemala, Honduras, Mexico, Nicaragua, Panama, Paraguay, Peru, the Dominican Republic, Uruguay, and the Bolivarian Republic of Venezuela. It does not include maquila for Honduras and Nicaragua. Data for the Bolivarian Republic of Venezuela beginning in October 2013 are estimated based on mirror statistics from its main trading partners that were assumed to have repeating shares in the same category in the same month of the previous year; for the period July-September 2014, the monthly DOTS trends are applied. By product categories, the largest changes with respect to January-September 2013 were registered in the exports of agricultural products (3.4% decrease) and, to a lesser extent, of mining and oil (1.8% drop). Meanwhile, the exports of manufactured goods that alone accounted for 58.2% of total exports in the first nine months of 2014 increased by 4.6%. The decline in export value can be mainly explained by the change in minerals and oil prices, which together represent about 30% of the total exports. Likewise, the Latin American commodities price index fell by 4.8% (see Table 6.b), with declines in products such as iron, copper, soy, and sugar. In terms of export volume, the heavy losses in gas, sugar, beverages, and meat must be acknowledged, as well as the reported increase in exported iron (see Table 6a). TRADE Statistics BULLETIN www.eclac.org/comercio 5 Table 6. Latin America and the Caribbean: Main Products Exported, January - September 2014 (Millions of current US$, percentages and price indices 2010=100) a) Selected Products b) Product Groups Value Prices Volume Prices Jan-Sep Jan-Sep Value Sep Jan-Sep Jan-Sep Price change Jan-Sep Jan-Sep Price Sep (E) 2013 2014 change 2014 2013 2014 change 2013 2014 change 2014 Sugar 2% 11 434 9 104 -20.4 195.9 216.6 211.5 -2.3 -18.0 Foodstuff 10% 170.6 172.0 0.8 169.0 Banana 1% 3 009 3 312 10.1 220.6 220.7 223.7 1.4 8.7 Beverages 3% 129.6 164.8 27.2 109.8 Beverages (A) 3% 6 746 7 370 9.2 172.6 129.6 164.8 27.2 -18.0 Oils and 207.4 195.3 -5.8 209.6 8% Meats 2% 17 379 18 739 7.8 310.1 209.5 243.1 16.0 -8.2 flours 152.1 153.3 0.8 153.8 Copper 9% 38 827 36 794 -5.2 379.1 407.2 382.8 -6.0 0.8 Other agro 9% 239.8 206.2 -14.0 234.5 Gas 2% 6 134 5 734 -6.5 90.9 85.5 105.7 23.6 -30.1 Minerals and 177.5 176.4 -0.6 176.6 27% Iron-Steel (B) 5% 10 440 11 621 11.3 304.8 489.8 378.4 -22.7 34.1 metals 170.6 172.0 0.8 169.0 Oil 30% 128 151 116 959 -8.7 357.4 387.4 385.7 -0.4 -8.3 Fuels 45% 129.6 164.8 27.2 109.8 Soy (C) 3% 27 094 28 151 3.9 203.9 255.6 240.4 -5.9 9.8 Sub-total 57% 249 214 237 783 -4.6 183.2 203.2 196.2 -3.5 -1.1 Total 100% 192.2 183.1 -4.8 190.0 Source: ECLAC based on data from Statistical Offices, Central Banks, Export Promotion Agencies, CEPALSTAT and the World Bank. See description in the Excel spreadsheet in the Annex. Notes: Product statistics are made up by main exporters in the region and not with all countries; in each case, they represent more than 70% of the annual total in that product. In the case of prices, it is an index calculated by ECLAC. (A) Average of coffee, tea, and yerba mate; (B) Made up of iron and steel manufactures; (C) Soy grains; (D) Weight of each product in the total regional exports; (E) Weight of each group in natural resources and manufacturing exports in the region. Products (D) Recent Activities of the International Trade and Integration Division Publications La Alianza del Pacífico y el MERCOSUR: hacia la convergencia en la diversidad Oportunidades para el aprovechamiento del protocolo comercial entre Guatemala y Chile Panorama de la Inserción Internacional de Latin America and the Caribbean 2014: integración regional y cadenas de valor en un escenario externo desafiante Estudio sobre la complementariedad comercial entre Honduras y Uruguay Huella de carbono, exportaciones y estrategias empresariales frente al cambio climático Informe del cuarto Seminario internacional sobre la huella de carbono "Huella ambiental en las exportaciones de alimentos de América Latina: normativa internacional y prácticas empresariales" Integración regional: hacia una estrategia de cadenas de valor inclusivas Cadenas globales de valor y diversificación de exportaciones: el caso de Costa Rica Estudio sobre la complementariedad comercial entre Honduras y Uruguay Latin America's emergence in global services Promoción del comercio y la inversión con China: desafíos y oportunidades en la experiencia de las cámaras empresariales latinoamericanas La cooperación entre América Latina y la Unión Europea: una asociación para el desarrollo Panorama de la inserción internacional de Latin America and the Caribbean 2013 Strengthening biregional cooperation between Latin America and Asia-Pacific: the role of FEALAC Events Taller: Indicadores de Comercio Exterior y Política Comercial V Encuentro Regional: Análisis de Políticas Públicas con Modelos de Equilibrio General Computable (EGC) Seminario Internacional. Facilitando la efectiva integración de países en desarrollo a la economía global a través de programas de Ayuda para el Comercio. VI Seminario Internacional CEPAL sobre la Huella de Carbono. Programas piloto de huella ambiental en productos de exportación Seminario: "Comercio, Inversión Extranjera Directa en Latinoamérica y Cadenas Globales de Valor: Una Estrategia de Inserción Internacional e Integración para América Latina" Foro Interregional del Proyecto de la Cuenta de Desarrollo: "Facilitando la efectiva integración de los países en desarrollo a la economía global a través de ayuda para el comercio" Taller de Indicadores de Comercio Exterior y Política Comercial TALLER REGIONAL: "Bases de datos para identificar y caracterizar a las pymes exportadoras" Seminario: "La asociación estratégica entre la Unión Europea y América Latina" Reunión de Expertos: "Facilitando la efectiva integración de países en desarrollo en la economía global a través de programas de Ayuda para el Comercio" Seminario internacional: "Cadenas de valor globales y regionales: experiencias Asia y América Latina" Diálogo regional sobre la promoción del desarrollo y el comercio de servicios en Latin America and the Caribbean Seminario internacional: "Facilitando la efectiva integración de los países en desarrollo a la Economía Global a través de Programas de Ayuda para el Comercio" This document, which has not been submitted to formal editing, was prepared by the International Trade and Integration Division at the Economic Commission for Latin America and the Caribbean (ECLAC). Copyright © United Nations, 2014. All rights reserved. TRADE Statistics BULLETIN www.eclac.org/comercio 6
