bulletin_second_quarter_2014_no15 PDF | 1.014 Mb
Anuncio
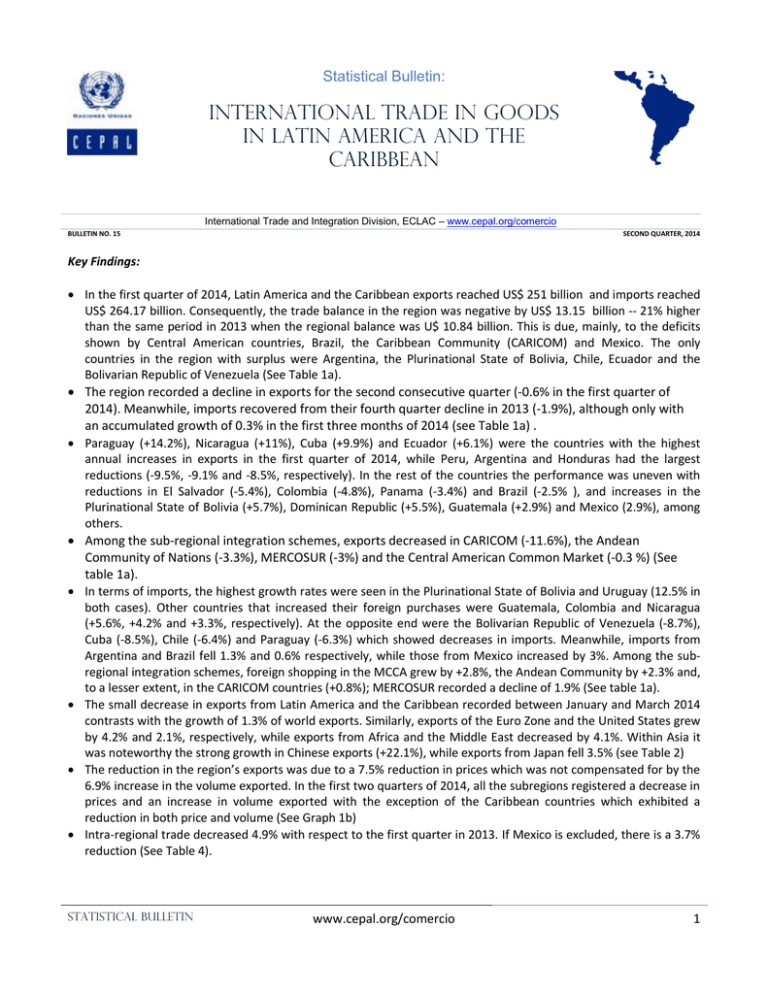
Statistical Bulletin: INTERNATIONAL TRADE IN GOODS IN LATIN AMERICA AND THE CARIBBEAN International Trade and Integration Division, ECLAC – www.cepal.org/comercio BULLETIN NO. 15 SECOND QUARTER, 2014 Key Findings: In the first quarter of 2014, Latin America and the Caribbean exports reached US$ 251 billion and imports reached US$ 264.17 billion. Consequently, the trade balance in the region was negative by US$ 13.15 billion -- 21% higher than the same period in 2013 when the regional balance was U$ 10.84 billion. This is due, mainly, to the deficits shown by Central American countries, Brazil, the Caribbean Community (CARICOM) and Mexico. The only countries in the region with surplus were Argentina, the Plurinational State of Bolivia, Chile, Ecuador and the Bolivarian Republic of Venezuela (See Table 1a). The region recorded a decline in exports for the second consecutive quarter (-0.6% in the first quarter of 2014). Meanwhile, imports recovered from their fourth quarter decline in 2013 (-1.9%), although only with an accumulated growth of 0.3% in the first three months of 2014 (see Table 1a) . Paraguay (+14.2%), Nicaragua (+11%), Cuba (+9.9%) and Ecuador (+6.1%) were the countries with the highest annual increases in exports in the first quarter of 2014, while Peru, Argentina and Honduras had the largest reductions (-9.5%, -9.1% and -8.5%, respectively). In the rest of the countries the performance was uneven with reductions in El Salvador (-5.4%), Colombia (-4.8%), Panama (-3.4%) and Brazil (-2.5% ), and increases in the Plurinational State of Bolivia (+5.7%), Dominican Republic (+5.5%), Guatemala (+2.9%) and Mexico (2.9%), among others. Among the sub-regional integration schemes, exports decreased in CARICOM (-11.6%), the Andean Community of Nations (-3.3%), MERCOSUR (-3%) and the Central American Common Market (-0.3 %) (See table 1a). In terms of imports, the highest growth rates were seen in the Plurinational State of Bolivia and Uruguay (12.5% in both cases). Other countries that increased their foreign purchases were Guatemala, Colombia and Nicaragua (+5.6%, +4.2% and +3.3%, respectively). At the opposite end were the Bolivarian Republic of Venezuela (-8.7%), Cuba (-8.5%), Chile (-6.4%) and Paraguay (-6.3%) which showed decreases in imports. Meanwhile, imports from Argentina and Brazil fell 1.3% and 0.6% respectively, while those from Mexico increased by 3%. Among the subregional integration schemes, foreign shopping in the MCCA grew by +2.8%, the Andean Community by +2.3% and, to a lesser extent, in the CARICOM countries (+0.8%); MERCOSUR recorded a decline of 1.9% (See table 1a). The small decrease in exports from Latin America and the Caribbean recorded between January and March 2014 contrasts with the growth of 1.3% of world exports. Similarly, exports of the Euro Zone and the United States grew by 4.2% and 2.1%, respectively, while exports from Africa and the Middle East decreased by 4.1%. Within Asia it was noteworthy the strong growth in Chinese exports (+22.1%), while exports from Japan fell 3.5% (see Table 2) The reduction in the region’s exports was due to a 7.5% reduction in prices which was not compensated for by the 6.9% increase in the volume exported. In the first two quarters of 2014, all the subregions registered a decrease in prices and an increase in volume exported with the exception of the Caribbean countries which exhibited a reduction in both price and volume (See Graph 1b) Intra-regional trade decreased 4.9% with respect to the first quarter in 2013. If Mexico is excluded, there is a 3.7% reduction (See Table 4). Statistical bulletin www.cepal.org/comercio 1 A – Trade by origin and destination Table 1. Latin America and the Caribbean: Trends of goods exports (Millions of current dollars and rates of growth in percentages) a) Accumulated from January to March Exports 15 877 3 171 49 588 19 037 13 454 2 844 1 466 6 604 1 289 2 682 1 025 90 872 696 191 2 549 9 281 2 379 1 661 21 937 251 014 32 511 4 410 8 726 91 612 Argentina Bolivia, Plur. St. of Brazil Chile Colombia Costa Rica Cuba Ecuador El Salvador Guatemala Honduras Mexico Nicaragua Panama Paraguay Peru Dominican Republic Uruguay Venezuela, Bol. Rep. of Latin America and the Caribbean Andean Community (ACN) Caribbean Community (CARICOM) Central American Common Market (MCCA) Southern Common Market (MERCOSUR) January -March 2014 Imports 15 756 2 210 55 660 16 961 14 760 4 518 2 056 6 478 2 615 4 379 2 170 92 064 1 330 3 169 2 587 10 316 3 302 2 979 14 429 264 168 33 764 6 429 18 181 91 411 Variation Balance Exports 121 961 -6 072 2 077 -1 305 -1 674 - 590 126 -1 326 -1 698 -1 145 -1 192 - 634 -2 978 - 38 -1 035 - 922 -1 318 7 509 -13 154 -1 253 -2 020 -9 455 201 Imports -9,1 5,7 -2,5 1,8 -4,8 0,2 9,9 6,1 -5,4 2,9 -8,5 2,9 11,0 -3,4 14,2 -9,5 5,5 -0,8 -1,5 -0,6 -3,3 -11,6 -0,3 -3,0 -1,3 12,5 -0,6 -6,4 4,2 2,9 -8,5 -2,1 2,9 5,6 -2,0 3,0 3,3 2,0 -6,3 0,6 -0,3 12,5 -8,7 0,3 2,3 0,8 2,8 -1,9 b) Exports from April 2013 to March 2014 Argentina Bolivia, Pl. St. of Brazil Chile Colombia Costa Rica Cuba Ecuador El Salvador Guatemala Honduras Mexico Nicaragua Panama Paraguay Peru Dominican Republic Uruguay Venezuela, Bol. Rep. of Latin America and the Caribbean ACN CARICOM CACM MERCOSUR Apr-13 7 372 1 010 20 631 6 766 4 949 993 609 1 934 489 889 355 32 861 231 71 918 3 188 824 713 7 859 May-13 8 501 1 018 21 822 7 011 5 332 1 017 470 2 055 520 965 353 32 836 208 75 976 3 479 927 988 6 986 Jun-13 7 583 1 011 21 134 6 341 4 871 978 488 1 983 451 808 320 31 025 197 62 920 3 252 776 1 002 7 540 Jul-13 7 398 1 051 20 807 6 338 4 652 946 556 2 130 491 827 308 32 212 196 80 908 3 331 857 885 7 124 Aug-13 7 474 1 052 21 424 6 377 4 978 935 655 2 102 478 805 288 32 668 191 76 924 4 101 826 934 7 673 Sep-13 6 846 1 013 20 850 5 812 4 850 970 463 2 195 425 733 290 31 385 182 77 697 3 566 782 803 7 434 Oct-13 7 144 1 110 22 821 7 025 4 838 1 006 502 2 124 450 768 270 35 088 202 76 658 3 511 849 673 7 094 Nov-13 6 609 966 20 861 6 115 4 944 981 528 2 025 400 804 289 31 703 190 70 661 3 217 762 655 7 482 Dec-13 5 267 975 20 846 6 208 5 272 880 531 2 186 425 826 359 32 086 179 60 538 3 612 719 728 7 024 Jan-14 5 231 1 012 16 026 5 531 4 775 851 515 2 033 403 839 339 27 038 226 59 734 3 000 793 597 7 764 Feb-14 5 393 1 023 15 934 6 214 4 271 958 401 2 150 412 807 328 30 520 210 61 864 3 178 793 460 6 821 Mar-14 5 253 1 137 17 628 7 292 4 408 1 035 551 2 421 474 1 035 357 33 314 260 71 951 3 103 793 604 7 352 94 326 11 082 1 663 3 028 37 493 97 115 11 884 1 577 3 137 39 274 92 457 11 118 1 715 2 816 38 179 92 731 11 164 1 634 2 848 37 122 95 507 12 233 1 545 2 773 38 430 90 703 11 624 1 330 2 676 36 630 97 634 11 583 1 425 2 772 38 390 90 608 11 152 1 347 2 734 36 268 90 099 12 045 1 377 2 728 34 403 79 094 10 820 1 326 2 717 30 353 82 169 10 622 1 370 2 777 29 472 89 751 11 069 1 713 3 232 31 788 Statistical bulletin www.cepal.org/comercio 2 c) Imports from April 2013 to March 2014 Apr-13 May-13 Jun-13 Jul-13 Aug-13 Sep-13 Oct-13 Nov-13 Dec-13 Jan-14 Feb-14 Mar-14 Argentina 6 378 7 063 6 368 7 022 7 107 6 130 6 550 5 912 5 160 5 196 5 349 5 211 Bolivia, Pl. St. of 712 736 578 711 800 694 833 779 938 779 764 667 Brazil 21 622 21 059 18 826 22 706 20 201 18 857 23 051 19 123 18 194 20 084 18 059 17 517 Chile 6 388 6 685 5 768 6 539 6 689 5 803 6 695 5 674 6 207 6 092 5 311 5 558 Colombia 5 167 5 181 4 311 5 112 4 975 5 148 5 348 5 033 4 935 4 844 5 003 4 912 Costa Rica 1 606 1 488 1 390 1 538 1 525 1 502 1 610 1 533 1 431 1 520 1 375 1 623 Cuba 762 774 740 751 699 728 767 760 824 684 625 747 Ecuador 2 249 2 499 2 228 2 277 2 550 2 199 2 454 2 207 2 023 2 337 1 972 2 168 El Salvador 947 957 961 967 934 831 942 895 796 905 814 896 Guatemala 1 610 1 596 1 382 1 532 1 387 1 474 1 605 1 443 1 333 1 547 1 356 1 476 Honduras 738 714 710 804 767 733 798 807 824 680 699 791 Mexico 34 088 33 306 30 168 33 651 32 902 30 726 35 217 31 364 30 441 30 234 29 543 32 287 Nicaragua 493 466 479 491 510 445 488 463 500 473 409 447 Panama 1 027 1 203 1 069 1 112 1 115 960 1 297 1 102 1 041 1 076 1 033 1 061 Paraguay 1 056 936 828 923 965 966 991 922 952 868 855 865 Peru 3 188 3 479 3 252 3 331 4 101 3 566 3 511 3 217 3 612 3 730 3 087 3 499 Dominican Republic 1 107 1 140 1 158 1 182 1 175 1 142 1 310 1 161 1 190 1 101 1 101 1 101 Uruguay 992 1 018 828 988 1 011 1 129 1 105 982 941 1 083 905 991 Venezuela, Bol. Rep. of 4 127 3 392 7 121 4 194 4 228 4 801 4 827 4 846 4 728 5 268 4 475 4 686 Latin America and the 96 274 95 608 90 385 97 813 95 960 90 134 101 441 90 351 88 357 90 653 84 669 88 847 Caribbean ACN 11 316 11 895 10 369 11 431 12 426 11 607 12 146 11 236 11 508 11 691 10 827 11 246 CARICOM 2 019 1 916 2 219 1 982 2 318 2 300 2 042 2 128 2 288 2 150 1 933 2 347 CACM 6 420 6 425 5 992 6 445 6 238 5 945 6 740 6 243 5 926 6 201 5 687 6 293 MERCOSUR 34 174 33 467 33 972 35 832 33 513 31 883 36 523 31 785 29 975 32 500 29 643 29 269 Source: ECLAC based on data from Statistics Institutes, Central Banks, Export Promotion Agencies, the United States International Trade Commission, the EU EUROSTAT, Statistics Canada, International Monetary Fund Direction of Trade Statistics (DOTS) and the Central American Monetary Council. Notes: Data for the Bolivarian Republic of Venezuela is estimated for July to September 2014 and the monthly DOTS trends were applie d; Mirror statistics from main trading partners were used beginning in October 2013. Data for Cuba and the CARICOM countries are estimated based on mirror statistics Data for Honduras and Nicaragua does not include maquila. Data is estimated for the Bolivarian Republic of Venezuela for the periods October to December 2013; Data for the Dominican Republic is estimated for May 2014. MERCOSUR data includes the Bolivarian Republic of Venezuela and those of CACM include Panama. Graph 1. Latin America and the Caribbean: Trends in exports, January-March 2014 a) Rates of variation compared to the previous year Caribbean countries 4,9 CACM Andean countries MERCOSUR South America Detail of growth in price and volume in comparison to the previous year -7,1 Mexico Chile b) -1,4 -0,2 -4,1 -10 -8 5,7 MERCOSUR -0,6 -4 -2 13,2 2 4 6 6,5 6,9 -7,5 -25 0 4,7 -9,0 Latin America and the Caribbean -6 -3,9 -7,7 South America -2,5 -4,7 7,2 Andean countries -16,5 -3,0 Latin America and the Caribbean 8,5 -7,4 Chile -3,3 -7,1 -2,3 -5,6 CACM 1,8 -7,5 -4,8 Mexico -6,2 -6,4 Caribbean countries 2,9 0 Price 25 Volume Jan-Mar 2014/Jan-Mar 2013 Source: ECLAC based on data from Statistics Institutes, Central Banks, Export Promotion Agencies, the United States International Trade Commission, the EU EUROSTAT, Statistics Canada, International Monetary Fund Direction of Trade Statistics (DOTS) and the Central American Monetary Council Notes: Data for the Bolivarian Republic of Venezuela are quarterly and the monthly DOTS trends were applied. Data for countries in the Caribbean (Cuba and CARICOM) were estimated using mirror statistics. Cuba’s deflator is built based on the volume imported by the European Union; the Caribbean’s deflator is built based on the deflators reported by Guyana and Jamaica to the International Monetary Fund. CACM statistics do not include maquila from Honduras or Nicaragua. MERCOSUR data includes the Bolivarian Republic of Venezuela. CACM data does not include Panama. Statistical bulletin www.cepal.org/comercio 3 In the first quarter of 2014, exports from the region declined 0.6%, following a 7.5% reduction in prices and which failed to be offset by the 6.9% increase in export volumes. In the first quarter of 2014, all sub-regions recorded decreases in prices and increases in export volumes, except for the Caribbean countries that showed losses of both prices and volumes (See Graph 1b). Graph 2 and Table 2. Latin America and the Caribbean and Selected Regions: Trends in export values, January 2006 – March 2014 Latin American and Caribbean Exports: Main destinations (January Index 2006=100) Variation compared to other regions (Accumulated to March of each year, in percentages) 1200 1000 800 600 United States European Union China Rest of Asia Latin America and the Caribbean Variation Q1 2012 Variation Q1 2013 Variation Q1 2014 9,9 11,5 3,9 7,6 -0,4 7,9 0,2 4,1 -4,7 -7,5 7,1 18,3 -12,4 1,3 1,0 0,5 -0,5 -4,1 -0,1 22,1 -3,5 2,1 4,2 1,3 Latin America and the Caribbean Africa and the Middle East Asia China Japan United States Euro Zone World 400 200 Jan-06 May-06 Sep-06 Jan-07 May-07 Sep-07 Jan-08 May-08 Sep-08 Jan-09 May-09 Sep-09 Jan-10 May-10 Sep-10 Jan-11 May-11 Sep-11 Jan-12 May-12 Sep-12 Jan-13 May-13 Sep-13 Jan-14 0 Source: ECLAC based on data from Statistics Institutes, Central Banks, Export Promotion Agencies, the United States International Trade Commission, the EU EUROSTAT, Statistics Canada, International Monetary Fund Direction of Trade Statistics (DOTS) and CPB Netherlands Bureau for Economic Policy Analysis. Notes: For the data for the Bolivarian Republic of Venezuela for the period between July and September 2014 DOTS monthly trends were used; beginning in 2013 data are estimated based on mirror statistics from main trading partners. Data for Cuba and the CARICOM countries are estimated based on mirror statistics. Graph 2 does not include Panama, the Dominican Republic; it also does not include maquila for Honduras and Nicaragua. In the first three months of 2014, the main destination of exports from Latin America and the Caribbean were the United States (41.2%), followed by Asia (19%) and the region itself (18%). In the case of imports, the United States was also the main provider (31.7%), followed by Asia (27.7%) and the region itself (17%) (See Table 3). Table 1. Latin America and the Caribbean: Trade with Main Partners, April 2013 to March 2014 (Millions of current dollars) Exports United States European Union Asia China Rest of Asia Latin America and the Caribbean Rest of the World Apr-13 93 431 36 989 10 829 18 248 9 546 8 703 16 793 10 572 May-13 96 113 36 599 10 963 20 882 11 567 9 315 17 919 9 751 Jun-13 91 619 34 792 10 269 18 699 9 825 8 874 18 261 9 599 Jul-13 91 794 36 217 10 983 18 125 8 430 9 695 17 151 9 318 Aug-13 94 605 36 273 11 128 19 707 10 466 9 242 17 454 10 042 Sep-13 89 844 34 426 10 863 18 134 9 366 8 767 17 262 9 159 Oct-13 96 708 39 200 12 330 17 727 8 605 9 122 18 115 9 336 Nov-13 89 776 34 426 9 797 16 430 8 584 7 846 18 936 10 187 Dec-13 89 320 35 648 9 571 16 972 8 421 8 550 16 736 10 392 Jan-14 78 241 31 875 8 813 14 512 7 132 7 380 14 114 8 928 Feb-14 81 315 34 012 8 936 15 308 7 401 7 907 14 497 8 562 Mar-14 Per. % 88 887 100,0 36 519 41,2 9 382 10,9 17 471 19,0 8 873 9,4 8 598 9,6 16 015 18,0 9 501 10,9 Imports 94 141 93 264 88 158 95 519 93 670 88 032 98 833 88 088 86 127 88 476 82 535 86 685 100,0 United States 28 976 27 743 24 978 27 985 28 460 26 776 29 510 27 125 26 418 27 018 26 112 28 512 31,7 European Union 14 007 14 099 12 731 13 911 13 927 12 318 13 768 12 848 11 763 11 938 10 935 12 182 13,6 Asia 24 773 25 325 23 213 26 805 25 852 24 472 28 403 23 983 23 232 25 745 22 899 22 844 27,7 China 12 775 13 592 12 668 14 968 14 668 14 380 16 376 13 618 13 407 14 967 12 951 12 257 15,6 Rest of Asia 11 998 11 733 10 545 11 837 11 184 10 091 12 027 10 365 9 980 10 899 9 821 10 374 12,1 Latin America and the Caribbean 17 851 17 894 16 063 17 129 17 519 16 625 17 889 16 113 15 394 14 755 13 944 15 028 17,0 Rest of the World 8 534 8 204 11 174 9 688 7 912 7 841 9 263 8 020 9 319 9 020 8 646 8 119 10,0 Source: ECLAC based on Statistical Institutes, Central Banks, Export Promotion Agencies, the United States International Trade Commission, EU EUROSTAT, Statistics Canada and the International Monetary Fund Division of Trade Statistics (DOTS). Notes: Includes data for Argentina, the Plurinational State of Bolivia, Brazil, Chile, Colombia, Costa Rica, Cuba, Ecuador, El Salvador, Guatemala, Honduras, Mexico, Nicaragua, Paraguay, Peru, Uruguay, Bolivarian Republic of Venezuela and CARICOM. It does not include maquila from Honduras or Nicaragua. Data for Cuba and CARICOM are estimated using mirror statistics from the United States, the European Union, Canada and the rest of Latin America. In the case of the Bolivarian Republic of Venezuela, the total was disaggregated utilizing mirror statistics from the United States, the European Union, Chile, Colombia and Japan and the rest of the MERCOSUR countries, the Andean Community, Mexico, Costa Rica, Guatemala and Nicaragua; DOTS structure was used for the rest of the destinations. Statistical bulletin www.cepal.org/comercio 4 With respect to the first quarter of 2013, regional exports to the EU fell 5.9%, while those destined to the United States grew by 2.1%. Meanwhile, sales to Asia continued with the dynamism recorded since the end of 2012 and increased 7%; shipments to the region itself fell 4.9%. Meanwhile, the most dynamic imports were from Asia (+5%), particularly from China (+6.7%). Table 2. Latin America: Intra-subregional and Intra-regional Trade, April 2013 to March 2014 (Percentages of total exports and rates of growth) Apr-13 8,0 21,6 13,7 16,2 7,3 18,0 May-13 7,2 22,8 13,6 18,1 7,5 18,6 Jun-13 7,4 23,7 12,9 18,4 7,7 19,9 Jul-13 7,9 24,3 14,3 19,2 7,6 18,7 Aug-13 6,2 23,6 13,8 19,3 7,9 18,4 Sep-13 7,8 25,5 14,7 18,5 7,7 19,2 Oct-13 7,7 25,0 15,3 18,5 7,1 18,7 Nov-13 6,9 25,9 16,0 20,2 6,8 21,1 Dec-13 6,5 23,3 14,6 16,6 5,8 18,7 Jan-14 6,8 23,7 14,0 16,1 6,0 18,0 Feb-14 7,3 23,3 15,4 17,5 6,2 17,8 Var. a Mar-14 Q1 14/Q1 13 8,5 -0,3 23,1 5,2 14,6 -2,5 16,2 0,6 6,7 -6,4 18,0 -4,9 Intra-CAN Intra-CACM Intra-MERCOSUR Chile to LAC Mexico to LAC Intra-LAC Intra-LAC w/o Mexico 18,4 19,1 20,7 24,7 24,0 25,4 25,4 28,9 26,0 24,4 24,8 24,8 -3,7 Source: ECLAC based on data from Statistics Institutes, Central Banks, Export Promotion Agencies, the United States International Trade Commission, the EU EUROSTAT, International Monetary Fund Direction of Trade Statistics (DOTS) Notes: (a) Rates of variation with respect to the same period the previous year. It does not include maquila for Honduras or Nicaragua. Data for MERCOSUR includes the Bolivarian Republic of Venezuela. Up to March 2014, the largest share of intra-subregional trade was observed in the Central American Common Market (23.1%) -- the only region whose coefficient is above the aggregate of Latin America and the Caribbean (18%). The Andean Community is still the group with the lowest coefficient of intra-subregional trade (8.5%). Negative variations recorded by Mexico's exports to the region (-6.4%) and by intra-MERCOSUR (-2.5%) and intra-CAN trade (-0.3%) should be highlighted. This is in contrast to the dynamism of intra-CACM exports (See Table 4). B – Trade by category and main products Table 3. Latin America and the Caribbean: Main traded product categories, April 2013 to March 2014 (Millions of current dollars) EXPORTS Agriculture and Livestock Mining and Petroleum Manufactures Apr-13 91 676 12 246 26 645 52 784 May-13 95 198 12 277 27 625 55 296 Jun-13 90 068 10 849 26 259 52 960 Jul-13 91 086 11 011 26 644 53 432 Aug-13 93 112 11 398 27 960 53 753 Sep-13 88 990 10 097 28 070 50 824 Oct-13 88 602 10 529 21 254 56 820 Nov-13 81 382 10 008 19 830 51 544 Dec-13 81 091 10 001 21 841 49 249 Jan-14 Feb-14 68 604 72 743 10 092 9 356 17 949 18 700 40 563 44 687 Mar-14 Per. % 79 257 100,0 10 264 13,5 19 045 25,2 49 947 61,3 IMPORTS 94 379 94 544 84 918 95 623 92 888 86 420 94 416 83 021 80 255 80 621 75 903 79 109 100,0 Capital Goods 16 838 16 937 15 348 16 991 16 271 15 136 16 892 15 556 15 813 15 047 13 041 13 374 17,6 Intermediate Inputs 45 129 46 252 41 888 46 598 45 862 43 174 46 600 40 947 38 294 38 901 37 893 40 926 50,0 Consumer Goods 18 092 17 200 16 075 17 969 18 253 17 335 19 320 16 787 16 063 15 067 14 037 14 319 18,4 Fuels 14 319 14 154 11 607 14 065 12 501 10 775 11 604 9 731 10 085 11 606 10 932 10 491 14,0 Source: ECLAC based on data from Statistics Institutes, Central Banks, Export Promotion Agencies, the United States International Trade Commission and the EU EUROSTAT. Notes: Includes data for Argentina, the Plurinational State of Bolivia, Brazil, Chile, Colombia, Costa Rica, Ecuador, El Salvador, Guatemala, Honduras, Mexico, Nicaragua, Panama, Paraguay, Peru, the Dominican Republic, Uruguay and the Bolivarian Republic of Venezuela. It does not include maquila from Honduras or Nicaragua. By product categories, the largest variations from January to March 2013 were recorded in exports of mining and petroleum (decreased 28.7%) and, to a lesser extent, in relation to agricultural products (down 7.9%). Meanwhile, manufacturing – accounting for most of the region’s exports - recorded a 0.1% reduction. The decline in export values was due mainly to the behavior of prices of minerals and petroleum -- which together account for just over 25% of total exports. Also in the first quarter of 2014, Latin American commodities price index fell 5.5% (see Table 6b), with declines in most of the products (especially iron, copper and sugar). In terms of export volumes, sharp declines in gas and oil and the increases in soy and iron should be highlighted (see Table 6a). Statistical bulletin www.cepal.org/comercio 5 Table 4. Latin America and the Caribbean: Main products exported, January-March 2014 (Millions of current dollars, percentages and price indexes 2000=100) a) Selected Products b) Product Groups Products Sugar Banana Beverages (A) Meats Copper Gas Iron-Steel (B) Petroleum Soy (C) Subtotal (D) 2% 1% 3% 2% 9% 2% 5% 30% 3% 57% Value Jan-Mar Jan-Mar Variation 2013 2014 in value 3 570 2 783 -22,0 1 038 1 114 7.3 2 131 1 797 -15.7 5 549 5 305 -4.4 12 199 11 981 -1.8 2 267 1 821 -19.7 3 125 3 800 21.6 43 018 20 275 -52.9 2 845 4 920 72.9 75 741 53 795 -29.0 Prices Variation Mar Jan-Mar Jan-Mar Variation in 2014 2013 2014 in prices volume 218,9 226,7 204,4 -9,9 -12,2 230.5 222.3 225.8 1.6 5.7 178.8 138.0 147.8 7.0 -22.7 225.5 220.7 218.6 -1.0 -3.4 367.7 437.2 388.3 -11.2 9.4 113.2 81.1 120.3 48.4 -68.1 404.0 536.1 435.3 -18.8 40.4 387.8 391.8 386.6 -1.3 -51.5 236.0 279.5 260.7 -6.7 79.6 197.0 211.1 199.7 -5.4 -23.6 (E) Food Beverages Oils and meals Other agro Minerals and Metals Fuels Total 10% 3% Prices Jan-Mar Jan-Mar Variation in 2013 2014 Prices 172,3 171,7 -0,3 138.0 147.8 7.0 Mar 2014 176,6 178.8 8% 214.6 209.0 9% 153.0 153.6 -2.6 205.0 0.4 155.4 27% 258.0 220.4 -14.6 209.9 45% 177.9 175.8 -1.2 177.4 100% 198.1 187.2 -5.5 186.3 Source: ECLAC based on data from Statistics Institutes, Central Banks, Export Promotion Agencies, CEPALSTAT and the World Bank. See description in the Excel spreadsheet in the Annex. Notes: Product statistics are made up by main exporters in the region and not with all countries; in each case, they represent more than 70% of the annual total for the region in that product. In the case of prices, it is an index calculated by ECLAC. (A) Average of coffee, tea and yerba mate; (B) Made up of iron and steel manufactures; (C) Soy grains; (D) Weight of each product in the total regional exports; (E) Weight of each group in natural resources and manufacturing exports in the region International Trade and Integration Division Recent Activities Publications Huella de carbono, exportaciones y estrategias empresariales frente al cambio climático Informe del cuarto Seminario internacional sobre la huella de carbono "Huella ambiental en las exportaciones de alimentos de América Latina: normativa internacional y prácticas empresariales" Integración regional: hacia una estrategia de cadenas de valor inclusivas Cadenas globales de valor y diversificación de exportaciones: el caso de Costa Rica Estudio sobre la complementariedad comercial entre Honduras y Uruguay Latin America's emergence in global services Promoción del comercio y la inversión con China: desafíos y oportunidades en la experiencia de las cámaras empresariales latinoamericanas La cooperación entre América Latina y la Unión Europea: una asociación para el desarrollo Panorama de la inserción internacional de América Latina y el Caribe 2013 Strengthening biregional cooperation between Latin America and Asia-Pacific: the role of FEALAC Comercio internacional y desarrollo inclusivo. Construyendo sinergias Documento de discusión para el seminario Cooperación para el desarrollo CELAC-Unión Europea: Desafíos post 2015 Huella de carbono y exportaciones de alimentos. Guía práctica Panorama de la inserción internacional de América Latina y el Caribe 2011-2012 La República Popular China y América Latina y el Caribe: Diálogo y cooperación ante los nuevos desafíos de la economía global Events VI Seminario Internacional CEPAL sobre la Huella de Carbono. Programas piloto de huella ambiental en productos de exportación Seminario: "Comercio, Inversión Extranjera Directa en Latinoamérica y Cadenas Globales de Valor: Una Estrategia de Inserción Internacional e Integración para América Latina" Foro Interregional del Proyecto de la Cuenta de Desarrollo: "Facilitando la efectiva integración de los países en desarrollo a la economía global a través de ayuda para el comercio" Taller de Indicadores de Comercio Exterior y Política Comercial TALLER REGIONAL: "Bases de datos para identificar y caracterizar a las pymes exportadoras" Seminario: "La asociación estratégica entre la Unión Europea y América Latina" Reunión de Expertos: "Facilitando la efectiva integración de países en desarrollo en la economía global a través de programas de Ayuda para el Comercio" Seminario internacional: "Cadenas de valor globales y regionales: experiencias Asia y América Latina" Diálogo regional sobre la promoción del desarrollo y el comercio de servicios en América Latina y el Caribe Seminario internacional: "Facilitando la efectiva integración de los países en desarrollo a la Economía Global a través de Programas de Ayuda para el Comercio" Seminario "Competitividad y Cadenas de Valor en América Latina" Seminario "Semana Asia" Taller de Huella de Carbono para productos de exportación, sector alimentos, de América Latina: prácticas empresariales This document, which has not been submitted to formal editing, was prepared by the International Trade and Integration Division at the Economic Commission for Latin America and the Caribbean (ECLAC). Copyright © United Nations, 2014. All rights reserved. Statistical bulletin www.cepal.org/comercio 6
