Geriatrics Gerontology Int - 2016 - Le n - Ultra‐short version of the oral health impact profile in elderly Chileans
Anuncio
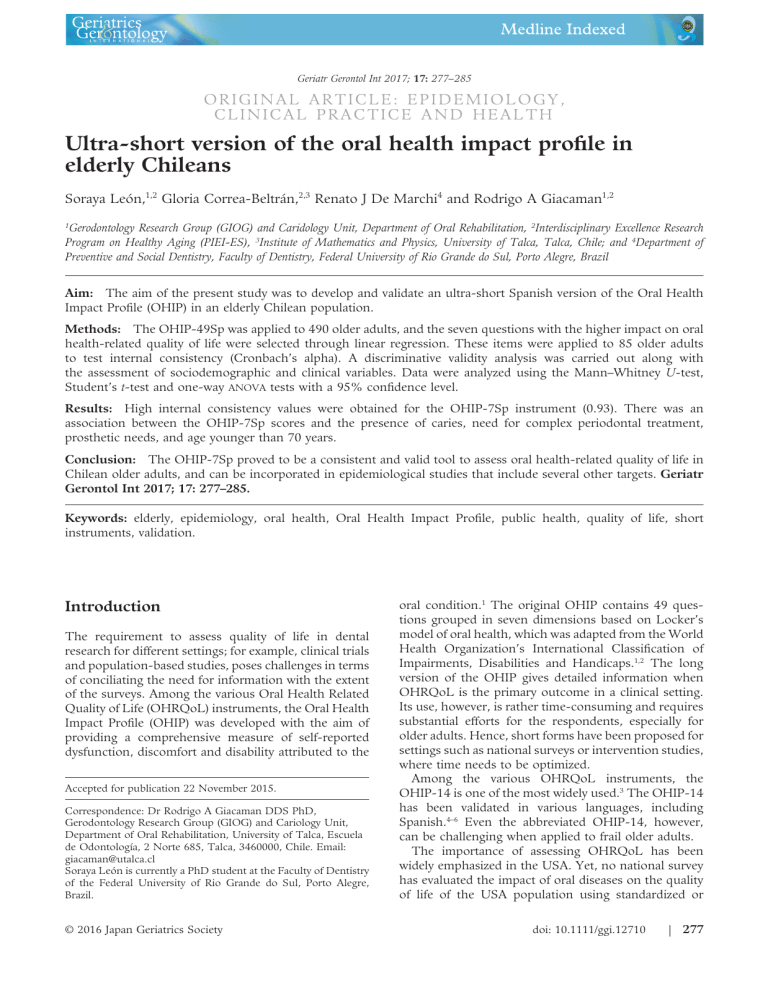
bs_bs_banner Geriatr Gerontol Int 2017; 17: 277–285 ORIGINAL ARTICLE: EPIDEMIOLOGY, CLINICAL PRACTICE AND HEALTH Ultra-short version of the oral health impact profile in elderly Chileans Soraya León,1,2 Gloria Correa-Beltrán,2,3 Renato J De Marchi4 and Rodrigo A Giacaman1,2 1 Gerodontology Research Group (GIOG) and Caridology Unit, Department of Oral Rehabilitation, 2Interdisciplinary Excellence Research Program on Healthy Aging (PIEI-ES), 3Institute of Mathematics and Physics, University of Talca, Talca, Chile; and 4Department of Preventive and Social Dentistry, Faculty of Dentistry, Federal University of Rio Grande do Sul, Porto Alegre, Brazil Aim: The aim of the present study was to develop and validate an ultra-short Spanish version of the Oral Health Impact Profile (OHIP) in an elderly Chilean population. Methods: The OHIP-49Sp was applied to 490 older adults, and the seven questions with the higher impact on oral health-related quality of life were selected through linear regression. These items were applied to 85 older adults to test internal consistency (Cronbach’s alpha). A discriminative validity analysis was carried out along with the assessment of sociodemographic and clinical variables. Data were analyzed using the Mann–Whitney U-test, Student’s t-test and one-way ANOVA tests with a 95% confidence level. Results: High internal consistency values were obtained for the OHIP-7Sp instrument (0.93). There was an association between the OHIP-7Sp scores and the presence of caries, need for complex periodontal treatment, prosthetic needs, and age younger than 70 years. Conclusion: The OHIP-7Sp proved to be a consistent and valid tool to assess oral health-related quality of life in Chilean older adults, and can be incorporated in epidemiological studies that include several other targets. Geriatr Gerontol Int 2017; 17: 277–285. Keywords: elderly, epidemiology, oral health, Oral Health Impact Profile, public health, quality of life, short instruments, validation. Introduction The requirement to assess quality of life in dental research for different settings; for example, clinical trials and population-based studies, poses challenges in terms of conciliating the need for information with the extent of the surveys. Among the various Oral Health Related Quality of Life (OHRQoL) instruments, the Oral Health Impact Profile (OHIP) was developed with the aim of providing a comprehensive measure of self-reported dysfunction, discomfort and disability attributed to the Accepted for publication 22 November 2015. Correspondence: Dr Rodrigo A Giacaman DDS PhD, Gerodontology Research Group (GIOG) and Cariology Unit, Department of Oral Rehabilitation, University of Talca, Escuela de Odontología, 2 Norte 685, Talca, 3460000, Chile. Email: [email protected] Soraya León is currently a PhD student at the Faculty of Dentistry of the Federal University of Rio Grande do Sul, Porto Alegre, Brazil. © 2016 Japan Geriatrics Society oral condition.1 The original OHIP contains 49 questions grouped in seven dimensions based on Locker’s model of oral health, which was adapted from the World Health Organization’s International Classification of Impairments, Disabilities and Handicaps.1,2 The long version of the OHIP gives detailed information when OHRQoL is the primary outcome in a clinical setting. Its use, however, is rather time-consuming and requires substantial efforts for the respondents, especially for older adults. Hence, short forms have been proposed for settings such as national surveys or intervention studies, where time needs to be optimized. Among the various OHRQoL instruments, the OHIP-14 is one of the most widely used.3 The OHIP-14 has been validated in various languages, including Spanish.4–6 Even the abbreviated OHIP-14, however, can be challenging when applied to frail older adults. The importance of assessing OHRQoL has been widely emphasized in the USA. Yet, no national survey has evaluated the impact of oral diseases on the quality of life of the USA population using standardized or doi: 10.1111/ggi.12710 | 277 validated instruments. Conversely, national surveys in other countries have measured the adverse impact of oral conditions on well-being using the multidimensional and validated OHIP-14.3 In Chile, only the 2003 version of the National Health Survey included questions about OHRQoL, but not using validated instruments. In fact, the National Survey of Quality of life in the Elderly has never included questions regarding OHRQoL. In this type of country-targeted studies, validated instruments previously used in other countries should be ideally applied. Thus, the ultra-short version of OHIP,7–9 appears as a reasonable option. Although the 14-item6 and 49-item10 versions of the OHIP have been validated in Chile, the ultra-short version with only seven items has not been used or validated. A brief instrument such as the ultra-short version of the OHIP represents a powerful tool to assess the impact of oral health on the quality of life on the elderly population. Its inclusion in national surveys might be an opportunity to easily obtain non-existent data in Chile, which in turn can serve as health policy-generating information. Therefore, the purpose of the present study was to develop and validate the Spanish version of the OHIP-7 in an elderly Chilean population. Methods Sample group and data collection Two different studies were carried out: a cross-sectional study to develop the abbreviated OHIP-7Sp with 490 community-dwelling older adults and a retrospective study to validate the OHIP-7Sp, which used a previously obtained database of 85 community-dwelling older adults.10 A convenience sample of patients was recruited from the School of Dentistry of the University of Talca, the Dental Specialties Clinic of the Talca’s Regional Hospital, social clubs for older adults and community healthcare centers from Talca. Ten participants per each of the questions from the OHIP-49 was required to obtain the sample size of 490 subjects.11 For the cross-sectional and the retrospective study, eligible participants should be community-dwelling and aged 60 years or older. Exclusion criteria were cognitive impairment and alcoholism. The study protocol was approved by the Ethics Committee of the University of Talca. The study was carried out between June and October, 2012. After signing an informed consent Form, two trained dentists applied the OHIP-49Sp, previously validated.10 To facilitate the answers, a printed chart with all the possible answers in a Likert-type scale with clear and large letters was shown to the participants. The questionnaires were completed by the researchers. The survey approach was chosen due to the high number of 278 | Chilean older adults with low educational levels and the high prevalence of visual problems at older ages. Statistical analysis By adding the final score of each of its seven domains, the final OHIP-49Sp score was obtained, ranging between 0 and 196 points. Using the OHIP-49Sp results, a linear regression model was carried out to obtain the abbreviated version of the instrument with seven questions. A controlled stepwise selection procedure was used to select seven items that mainly contributed to R2, with the condition that only one item from each conceptual dimension was permitted to enter the regression model. For the validation study, the seven previously selected questions from the cross-sectional study were tested against a retrospective cohort of 85 participants that had been previously assessed during the validation of the Spanish version of the OHIP-49.10 Internal consistency was determined using the Cronbach’s α test, as well as the inter-item and total-item correlations. Scores were calculated using the additive method, considering values between 0 and 28. Responses to questions about the perceived impact of oral problems over the preceding year were presented as a five-point ordinal scale coded 0 = never, 1 = hardly ever, 2 = occasionally, 3 = fairly often and 4 = very often. Each theoretical dimension of the OHIP was represented by an OHIP7Sp question. Consistent with the system established by Slade et al.12 and one previous national survey using the OHIP-7,7 scores were used to obtain severity and prevalence outcomes, with higher values denoting poorer OHQoL, as follows: • Severity was the addition of all ordinal response codes. Severity scores had a potential range of 0–28 across the seven items, used for discriminant validity. • Prevalence was the percentage of people responding “fairly often” or “very often” to one or more questions. For discriminant validity, the seven selected questions in the cross-sectional study were contrasted with sociodemographic and clinical variables obtained in the retrospective study of 85 participants. Parametric oneway ANOVA and non-parametric Kruskal–Wallis tests were used. Statistical analyses were carried out using R and R commander version 3.0.1 software 2013, (R Foundation for Statistical Computing c/o Institute for Statistics and Mathematics, Vienna, Austria). Results Just two questions from Slade’s original OHIP-14 matched the present OHIP-7Sp: Q43 “difficulty doing jobs” and Q48 “unable to function,” corresponding to © 2016 Japan Geriatrics Society 14470594, 2017, 2, Downloaded from https://onlinelibrary.wiley.com/doi/10.1111/ggi.12710 by Universidade Andres Bello, Wiley Online Library on [07/05/2023]. See the Terms and Conditions (https://onlinelibrary.wiley.com/terms-and-conditions) on Wiley Online Library for rules of use; OA articles are governed by the applicable Creative Commons License S León et al. Social Disability and Handicap domains, respectively (Table 1). Each question of the seven items consisted in a five-point Likert Scale, including “never” = 0, “hardly ever” = 1, “occasionally” = 2, “fairly often” = 3 and “very often” = 4. Thus, the maximum score was 28 and the minimal was 0. The cut-off point to consider a negative impact of the OHRQoL was set at a final score above 7. The most negative impact on the OHIP-7Sp score arose from the physical pain and psychological discomfort domains (33%). Specifically, in the questions “sensitive teeth” and “dental problems made you miserable.” The negative impact in the psychological disability, social disability and handicap domains was very low (questions ranging from 10 to 11%; Table 1). Once obtained, the OHIP-7Sp internal consistency was assessed using the database with 85 participants.10 The sample was 61.18% women and 38.82% men, with an average age of 69.02 ± 7.82 years. Among them, 32.94% of the participants had between 20 and 28 teeth, and 27.06% were edentulous. Among participants who had at least one tooth, 52.9% had at least one carious lesion and 100% required periodontal treatment, either simple or complex (Community Periodontal Index of Treatment Needs [CPITN] 2 or 3). Prosthetic needs for either complete or removable partial denture was 74.12% and between those already wearing one. By analyzing the matrix of inter-item correlations (Table 2), a positive correlation between all items was found, ranging from 0.05 (the relationship between “sensitive teeth” and “difficulty doing jobs,” weak) to 0.59 (the relationship between “dental problems made you miserable” and “others misunderstood,” acceptable). No correlation resulted negative or high enough for any item to be redundant. The homogeneity of the scale was evaluated based on the corrected total-item correlation coefficient. These analyses consider the correlation between each individual item in the scale and the rest of the scale with the item of interest eliminated. The corrected total-item correlation coefficient ranged from 0.34 to 0.75. All values were above the minimum corrected total-item correlation of 0.20, which has been recommended for the inclusion of an item in a scale.13 Cronbach’s α for the total instrument total was 0.93 (Table 3). Regarding the prevalence estimate, three items ranked among the top three (Table 4) “dental problems made you miserable” (29.4%), “digestion worse” and “sensitive teeth” (15.3%). Participants were more inclined to report an impact that affected them “hardly ever” or “never.” When analyzing the OHIP-7Sp global score, the mean and median were 7.21 (SD 6.18) and 6 (range 0–22), respectively. Results from the discriminative validity tests showed that the global OHIP-7Sp scores had no significant relationship with the number of remaining teeth (Table 5). A statistically significant association was found between © 2016 Japan Geriatrics Society the global OHIP-7Sp score and caries (P = 0.01). Regarding the CPITN, all participants had simple (TN2) or complex periodontal treatment needs (TN3). A statistically significant association was observed between CPITN and the global OHIP-7Sp score (P = 0.003; Table 5). Likewise, a statistically significant association (P = 0.0003) was observed between the global OHIP7Sp and prosthetic needs (Table 5). When age was considered, the highest OHIP-7Sp scores were observed in the youngest group (60–69 years). A significant association was also found between the OHIP-7Sp (P = 0.0001) and the other domains, except for physical pain (Table 5). Discussion As in the original study of the OHIP-14, the method to obtain the OHIP-7Sp in the present study was a linear regression with one question per dimension.3 This item selection method has been shown to be more adequate than the internal reliability analysis or factor analysis.14 In addition to Slade’s approach to obtain a shortened OHIP version, Locker and Allen developed a different strategy, based on the modified clinical impact method.14 Both methodologies were applied in the development of the German short forms of the OHIP, and the authors concluded that, regardless of the methodologies used, the short and ultra-short OHIP questionnaires maintain the idea of the OHRQoL as a construct.15 Despite obtaining a low internal consistency in some domains, a high internal consistency was shown for the global instrument (Cronbach’s alpha of 0.93). The global consistency found here was higher than other ultra-short versions of OHIP.15–17 Although, Cronbach’s alpha between 0.70 and 0.80 is considered satisfactory to make reliable comparisons among groups. Thus, the high alpha value of 0.93 does indicate that the seven items of the OHIP-7Sp accurately measure the same construct as the whole original instrument. In this context, has been discussed that the current notion of the OHIP might not provide an adequate description of its dimensional validity, and its items might not represent the seven constructs of oral health as originally proposed.18 In fact, evidence from a study with Spanish workers showed that just three components explained 58.1% of variance OHIP-14, when confirmatory factorial analysis was carried out.19 Also, dos Santos et al. investigated the dimensional structure of the OHIP-14 with the use of confirmatory factorial analysis in two different samples of Brazilians, concluding that the OHIP-14 is, in fact, a single construct scale.20 Hence, in the present study, all analyses were carried out using global scores of the instruments, showing an excellent internal consistency. The use of this instrument, therefore, should be considered only | 279 14470594, 2017, 2, Downloaded from https://onlinelibrary.wiley.com/doi/10.1111/ggi.12710 by Universidade Andres Bello, Wiley Online Library on [07/05/2023]. See the Terms and Conditions (https://onlinelibrary.wiley.com/terms-and-conditions) on Wiley Online Library for rules of use; OA articles are governed by the applicable Creative Commons License Validation of the OHIP-7Sp Table 1 Regression analysis of the Spanish version of the Oral Health Impact Profile items and prevalence of negative impact among participants Domains and items OHIP-49Sp Functional limitation Q1: difficulty chewing Q2: trouble pronouncing words Q3: noticed tooth that doesn’t look right Q4: appearance affected Q5: breath stale Q6: taste worse Q7: food catching Q8: digestion worse† Q9: dentures not fitting Physical pain Q10: painful aching Q11: sore jaw Q12: headaches Q13: sensitive teeth† Q14: toothache Q15: painful gums Q16: uncomfortable to eat Q17: sore spots Q18: uncomfortable dentures Psychological discomfort Q19: worried by dental problems Q20: self-conscious Q21: dental problems made you miserable† Q22: felt uncomfortable about the appearance Q23: felt tense Physical disability Q24:speech unclear Q25: others misunderstood† Q26: less flavor in food Q27: unable to brush teeth Q28: avoid eating Q29: diet unsatisfactory Q30: unable to eat (dentures) Q31: avoid smiling Q32: interrupt meals Psychological disability Q33: sleep interrupted† Q34: upset Q35: difficult to relax Q36: depressed Q37: concentration affected Q38: been embarrassed Social disability Q39: avoid going out Q40: less tolerant of others Q41: trouble getting on with others Q42: irritable with others Q43: difficulty doing jobs† Handicap Q44: your general health has worsened Q45: financial loss Q46: unable to enjoy people’s company Q47: life unsatisfying Q48: unable to function† Q49: unable to work R2 for OHIP-7Sp† R2 for OHIP-14 (Slade)‡ Participants with negative impact (%) * * * * * * * 0.12 * * 0.016 * * * 0.032 * * * 54 35 48 42 46 43 75 19 40 * * * 0.14 * * * * * 0.024 * * * * * 0.14 * * 37 28 8 33 35 47 59 46 39 * * 0.08 * * * 0.057 * * 0.56 68 41 33 39 36 * 0.09 * * * * * * * * * * * * 0.003 * * 0.004 34 21 43 25 47 22 25 33 30 0.13 * * * * * * * 0.087 * * 0.006 10 26 27 27 20 39 * * * * 0.09 * * * 0.002 0.007 16 11 20 12 11 * * * * 0.06 * * * * 0.011 0.001 * 21 15 20 28 11 11 Q1–Q49: Questions of the OHIP-49Sp. †Items selected for the Spanish version of the Oral Health Impact Profile (OHIP-7Sp). ‡Items of the original Oral Health Impact Profile (OHIP)-14 developed by Slade. 280 | © 2016 Japan Geriatrics Society 14470594, 2017, 2, Downloaded from https://onlinelibrary.wiley.com/doi/10.1111/ggi.12710 by Universidade Andres Bello, Wiley Online Library on [07/05/2023]. See the Terms and Conditions (https://onlinelibrary.wiley.com/terms-and-conditions) on Wiley Online Library for rules of use; OA articles are governed by the applicable Creative Commons License S León et al. Table 2 Reliability analysis based on the Spanish version of the Oral Health Impact Profile inter-item correlation Impact item 1 2 3 1 Digestion worse 2 Sensitive teeth 3 Dental problems made you miserable 4 Others misunderstood 5 Sleep interrupted 6 Difficulty doing jobs 7 Unable to function 1 0.36 0.45 1 0.27 1 0.53 0.44 0.41 0.52 0.27 0.26 0.05 0.24 0.59 0.33 0.45 0.55 4 5 6 7 1 0.34 0.55 0.55 1 0.35 0.55 1 0.53 1 Table 3 Reliability analysis based on the corrected total-item correlation and Cronbach’s alpha coefficient if item deleted Impact item Corrected total-item correlation Cronbach’s alpha if item deleted 1 Digestion worse 2 Sensitive teeth 3 Dental problems made you miserable 4 Others misunderstood 5 Sleep interrupted 6 Difficulty doing jobs 7 Unable to function Global 0.63 0.34 0.67 0.79 0.84 0.79 0.65 0.51 0.46 0.75 0.79 0.81 0.82 0.77 0.93 Table 4 Distribution of responses at different frequency thresholds to Spanish version of the Oral Health Impact Profile items Individual OHIP Items 1 Digestion worse 2 Sensitive teeth 3 Dental problems made you miserable 4 Others misunderstood 5 Sleep interrupted 6 Difficulty doing jobs 7 Unable to function Global Never, hardly ever % 75.3 43.5 43.5 70.6 74.1 81.2 76.5 Mean‡ (SD) Median‡ (range) % Fairly often, very often % Rank† 9.4 41.2 27.1 22.4 16.5 9.4 10.6 15.3 15.3 29.4 7.1 9.4 9.4 12.9 0.89 (1.34) 1.45 (1.27) 1.74 (1.45) 0.80 (1.09) 0.86 (1.15) 0.67 (1.16) 0.80 (1.34) 7.21 (6.18) 0 (0–4) 2 (0–4) 2 (0–4) 0 (0–4) 0 (0–4) 0 (0–4) 0 (0–4) 6 (0–22) Occasionally 2 2 1 5 4 4 3 † Presented in rank order of prevalence scores; that is, percentage of adults reporting one or more items “fairly often” or “very often.” ‡Mean (SD) and median (range) scores in relation to severity. when the main purpose is the characterization of OHRQoL as a construct.15 Generally, the benefit arising from a reduction in the number of questionnaire items implies a concomitant reduced validity. In this case, no loss of validity was evident, nevertheless. © 2016 Japan Geriatrics Society A positive correlation inter-item was found, ranging from 0.05 to 0.59. A mean inter-item correlation of 0.15–0.20 is acceptable for scales measuring broad characteristics, whereas 0.40–0.50 is acceptable for scales measuring narrower concepts, as in the present study.21 | 281 14470594, 2017, 2, Downloaded from https://onlinelibrary.wiley.com/doi/10.1111/ggi.12710 by Universidade Andres Bello, Wiley Online Library on [07/05/2023]. See the Terms and Conditions (https://onlinelibrary.wiley.com/terms-and-conditions) on Wiley Online Library for rules of use; OA articles are governed by the applicable Creative Commons License Validation of the OHIP-7Sp 282 | © 2016 Japan Geriatrics Society No. teeth 0.36 (0.68) 0 1.05 (1.54) 0 1.4 (1.68) 1 1.09 (1.38) 1 0.1 Caries lesion 1(1.38) 0 0.35 (1.06) 0 0.03 CPITN 0.52 (1.09) 0 1.13 (1.48) 0 0.06 Prosthetic need 0.09 (0.29) 0 1.17 (1.44) 1 0.0004 Age (years) 1.15 (1.45) 0 0.48 (1.03) 0 0.01 Domain Functional limitation 1.60 (1.39) 2 1.21 (1.02) 2 0.2 1.27 (1.16) 1.5 1.51 (1.31) 2 0.4 1.42 (1.29) 2 1.87 (1.18) 2 0.1 1.84 (1.28) 2 1.12 (0.99) 2 0.04 1.64 (1.06) 2 1.47 (1.43) 2 1.87 (1.36) 2 0.91 (1.2) 0 0.09 Physical pain CPITN, Community Periodontal Index of Treatment Needs. 60–69 (n = 52) ≥70 n = 33) P No (n = 22) Yes (n = 63) P TN2 (n = 31) TN3 (n = 31) P Yes (n = 45) No (n = 17) P 20–28 (n = 28) 10–19 (n = 19) 1–9 (n = 15) Edentate (n = 23) P Variable 2.10 (1.43) 2 1.18 (1.31) 1 0.004 1.23 (1.31) 1 1.92 (1.46) 2 0.05 1.58 (1.36) 2 2.29 (1.47) 2 0.05 2.07 (1.45) 2 1.59 (1.42) 2 0.2 1.61 (1.31) 2 1.84 (1.46) 2 2.67 (1.50) 3 1.22 (1.35) 1 0.02 Psychological discomfort 0.98 (1.21) 0 0.52 (0.80) 0 0.03 0.09 (0.29) 0 1.05 (1.16) 1 0.0002 0.42 (0.85) 0 1.16 (1.19)1 0.006 1 (1.15) 1 0.24 (0.66) 0 0.007 0.64 (1.1) 0 0.47 (0.96) 0 1.47 (0.99) 2 0.83 (1.11) 0 0.04 Physical disability 1.17 (1.29) 1 0.36 (0.60) 0 0.0002 0.32 (0.65) 0 1.05 (1.22) 1 0.008 0.68 (1.22) 0 1.06 (1.12) 1 0.2 1 (1.26) 0 0.53 (0.87) 0 0.2 0.71 (1.18) 0 1.11 (1.2) 1 0.87 (1.19) 0 0.83 (1.07) 1 0.7 Psychological disability 0.88 (1.25) 0 0.33 (0.92) 0 0.03 0.14 (0.47) 0 0.86 (1.27) 0 0.005 0.35 (1.02) 0 0.97 (1.2) 1 0.03 0.69 (1.06) 0 0.59 (1.37) 0 0.2 0.64 (1.16) 0 0.37 (0.68) 0 1.07 (1.49) 0 0.7 (1.22) 0 0.4 Social disability 1.15 (1.56) 0 0.24 (0.56) 0 0.0003 0.05 (0.21) 0 1.06 (1.47) 0 0.0009 0.32 (0.79) 0 1.39 (1.67) 0 0.002 0.98 (1.42) 0 0.53 (1.33) 0 0.2 0.57 (1.23) 0 0.89 (1.41) 0 1.33 (1.63) 0 0.65 (1.19) 0 0.3 Handicap 9.04 (6.87) 7 4.33 (3.33) 4 0.0001 3.18 (2.48) 3 8.62 (6.47) 7 0.0003 5.29 (5.4) 4 9.97 (6.28) 9 0.003 8.58 (6.04) 8 4.94 (6.2) 3 0.01 6.18 (5.15) 4.5 7.21 (7) 5 10.67 (6.47) 10 6.22 (6.01) 5 0.1 Global OHIP-7Sp Table 5 Discriminant validity of the Spanish version of the Oral Health Impact Profile based on the oral variables and age of the participants. Mean, (SD), median 14470594, 2017, 2, Downloaded from https://onlinelibrary.wiley.com/doi/10.1111/ggi.12710 by Universidade Andres Bello, Wiley Online Library on [07/05/2023]. See the Terms and Conditions (https://onlinelibrary.wiley.com/terms-and-conditions) on Wiley Online Library for rules of use; OA articles are governed by the applicable Creative Commons License S León et al. However, in the corrected total-item correlation, coefficients ranged from 0.34 to 0.75, which were above the recommended minimum level of 0.20. These results show good homogeneity of the entire instrument, and avoid the need to eliminate items from the OHIP-7Sp. Yet, our scores are lower than those found by John et al.,15 but they are similar to those found by Larsson et al.17 The items with the highest response rate were “dental problems made you miserable” (29.4%), “digestion worse” and “sensitive teeth” (15.3%), belonging to the first three dimensions: functional limitation, physical pain and psychological discomfort. A similar trend has been shown in a previous study by Sanders et al.7 These results also corroborate previous evidence from two studies using exploratory factor analysis,22,23 and one study using confirmatory factorial analysis,19 which confirmed the existence of a set of three underlying factors considered as functional limitation, pain-discomfort and psychosocial impacts, that showed high consistency when integrated with the Locker model.2 In addition, the mean score for the global OHIP-7Sp was higher than other studies.7 It is interesting to highlight that in the studies with Australian and North American populations, there is a higher tendency to report items as “hardly ever” or “never” with the National Health and Nutrition Examination Survey (NHANES)-OHIP survey. The resulting scores, therefore, were lower than among Chileans. Prevalence has been frequently used to assess populations at the nation level, as they are easier to understand. From a methodological point of view, the use of prevalence is convenient to allow comparisons with other populations or the same population over time. When evaluating discriminative validity based on clinical variables, the most robust associations were observed between the presence of carious lesions, CPITN and prosthetic needs. As other validation studies of the ultrashort version of the OHIP have not used the same clinical variables, no comparison was possible. When compared with the results of our own validation of the short version of the OHIP (OHIP-14Sp), it is possible to find similar associations.6 Discriminative validation was not related with number of teeth in the OHIP-7Sp. It is reasonable to speculate that the use of dentures minimizes the consequences of tooth loss.24 Indeed, older adults with few teeth most likely will be denture wearers, so even if their prostheses are not functional, self-perception of quality of life might be interpreted as satisfactory if they have esthetically acceptable prostheses. Indeed, for some older people, edentulous and poor oral health are considered a part of “normal” aging. This apparent discrepancy might be a consequence of cultural and behavioral conditions, where tooth loss is perceived as a normal feature of aging.25 © 2016 Japan Geriatrics Society In addition, older individuals presented a lower negative impact of the oral diseases in their quality of life than younger individuals. The inverse relationship between age and the OHIP scores has been observed previously, where it was proposed that different historical experiences of birth cohorts altered expectations about oral health, thereby accounting for the observed age-group differences.7,26 It is widely acknowledged, however, that cross-sectional studies cannot satisfactorily explain the effects of aging on any given cohort. Hence, the current findings should not be interpreted as an indication that aging somehow attenuates adverse impacts of oral health on quality of life. As it has been proposed, the theory of response shift might explain why community-dwelling older adults, and the elderly population in general, might report lower impact in certain domains.27 Slade and Sanders analyzed the paradox of the better subjective oral health perception in older age.28 Their findings showed that experience of oral disease is more deleterious to subjective oral health when it occurs early in adulthood than when it occurs at older ages, likely reflecting high expectations of young generations and higher resilience in the oldest generation. Resilience and coping mechanisms might explain why many older people who experience limitations related to the aging process also report good levels of wellbeing.29,30 Furthermore, it suggested that the OHRQoL instruments are usually too disease oriented, assuming that disability and handicap will necessarily result from oral problems.30 Yet, such problems might be less of a priority at this age, and people might cope and adapt with limitations related to oral health, in a positive manner. The limitations of the present study were the crosssectional study design and the descriptive nature of the analyses. These constraints mean that caution is required in data interpretation. Yet, the purpose of cross-sectional surveys is to provide prevalence estimates for the study population and to lead to new hypotheses. Thus, the present design appears as appropriate, as it allows its further use during a future first national survey of the impact of oral conditions on quality of life in Chile. We deem it important to acknowledge that for the discriminative validity analysis, the sample size was calculated for the OHIP-49Sp and not for the OHIP-7Sp.10 The present study has implications for public health and for future studies on OHRQoL. Using the association between oral health conditions and quality of life can be an effective mechanism to convey to policymakers the importance of oral health and equal access to care. Along those lines, the main goal of the Policy of Positive Aging 2012–2025 in Chile is to improve quality of life for all Chilean older adults. Hence, it is critically important that OHRQoL can be | 283 14470594, 2017, 2, Downloaded from https://onlinelibrary.wiley.com/doi/10.1111/ggi.12710 by Universidade Andres Bello, Wiley Online Library on [07/05/2023]. See the Terms and Conditions (https://onlinelibrary.wiley.com/terms-and-conditions) on Wiley Online Library for rules of use; OA articles are governed by the applicable Creative Commons License Validation of the OHIP-7Sp included in national health surveys to raise awareness of the importance of oral health in the quality of life of the population. We strongly suggest including the OHIP7Sp in future surveys to monitor the achievements of the Chilean Policy of Positive Aging 2012–2025. In conclusion, results from the present study corroborate the ultra-short Spanish version of the OHIP as a valid instrument to assess OHRQoL in elderly Chileans. The ultra-short version of the OHIP offers OHRQoL assessment in almost any setting. It is expected that this validated version of the OHIP-7Sp will be a useful alternative to the OHIP-14Sp in situations where time and resources are restricted, and it might be incorporated in epidemiological studies that include several other variables. The OHIP-7Sp, therefore, appears now as a suitable tool for cross-national comparisons of OHRQoL. Acknowledgments The authors appreciate the collaboration of Professor Cecilia Albala for her insights in the planning of this study. We also thank Francisca Espinoza and Francia Fuentes, predoctoral dental students at the time of the study, for their help in data collection and registration. This research was partially funded by an Internal Grant from the Research Direction of the University of Talca and a Chile’s Government Grant Fondecyt 1140623 to RAG. The funders did not participate in the study design, data collection or the analysis. Disclosure statement The authors declare no conflict of interest. References 1 Slade GD, Spencer AJ. Development and evaluation of the Oral Health Impact Profile. Community Dent Health 1994; 11: 3–11. 2 Locker D. Measuring oral health: a conceptual framework. Community Dent Health 1988; 5: 3–18. 3 Slade GD. Derivation and validation of a short-form oral health impact profile. Community Dent Oral Epidemiol 1997; 25: 284–290. 4 Castrejón-Pérez RC, Borges-Yáñez SA. Derivation of the short form of the Oral Health Impact Profile in Spanish (OHIP-EE-14). Gerodontology 2012; 29: 155–158. 5 Montero-Martín J, Bravo-Pérez M, Albaladejo-Martínez A, Hernández-Martín LA, Rosel-Gallardo EM. Validation the Oral Health Impact Profile (OHIP-14sp) for adults in Spain. Med Oral Patol Oral Cir Bucal 2009; 14: E44–E50. 6 León S, Bravo-Cavicchioli D, Correa-Beltrán G, Giacaman RA. Validation of the Spanish version of the Oral Health Impact Profile (OHIP-14Sp) in elderly Chileans. BMC Oral Health 2014; 14: 95. 7 Sanders AE, Slade GD, Lim S, Reisine ST. Impact of oral disease on quality of life in the US and Australian populations. Community Dent Oral Epidemiol 2009; 37: 171–181. 284 | 8 NHANES. Data Documentation. SP Questionnaire Component: Oral Health Questionnaire Data. 2007–2008. [Cited 30 June 2015.] Available from URL: http:// wwwn.cdc.gov/Nchs/Nhanes/2007-2008/OHQ_E.htm 9 Carter K, Stewart J. National Dental Telephone Interview Survey 1999. AIHW cat. no. DEN 109. Adelaide: AIHW Dental Statistics and Research Unit. 2002. 10 León S, Bravo-Cavicchioli D, Giacaman RA, CorreaBeltrán G, Albala C. Validation of the Spanish version of the oral health impact profile to assess an association between quality of life and oral health of elderly Chileans. Gerodontology 2014. doi: 10.1111/ger.12124; [Epub ahead of print]. 11 Thorndike R. Applied Psychometrics. Boston: Houghton Mifflin, 1982. 12 Slade GD, Nuttall N, Sanders AE, Steele JG, Allen PF, Lahti S. Impacts of oral disorders in the United Kingdom and Australia. Br Dent J 2005; 198: 489–493, discussion 83. 13 Streiner D, Norman G. Health Measurement Scales: A Practical Guide to their Development and Use, 2nd edn. Oxford: Oxford University Press, 1995. 14 Locker D, Allen PF. Developing short-form measures of oral health-related quality of life. J Public Health Dent 2002; 62: 13–20. 15 John MT, Miglioretti DL, LeResche L, Koepsell TD, Hujoel P, Micheelis W. German short forms of the Oral Health Impact Profile. Community Dent Oral Epidemiol 2006; 34: 277–288. 16 Baba K, Inukai M, John MT. Feasibility of oral healthrelated quality of life assessment in prosthodontic patients using abbreviated Oral Health Impact Profile questionnaires. J Oral Rehabil 2008; 35: 224–228. 17 Larsson P, John MT, Hakeberg M, Nilner K, List T. General population norms of the Swedish short forms of Oral Health Impact Profile. J Oral Rehabil 2014; 41: 275– 281. 18 Baker SR, Gibson B, Locker D. Is the oral health impact profile measuring up? Investigating the scale’s construct validity using structural equation modelling. Community Dent Oral Epidemiol 2008; 36: 532–541. 19 Montero J, Bravo M, Vicente MP, Galindo MP, López JF, Albaladejo A. Dimensional structure of the oral healthrelated quality of life in healthy Spanish workers. Health and Quality of Life Outcomes 2010; 8: 24. 20 Santos CM, Oliveira BH, Nadanovsky P, Hilgert JB, Celeste RK, Hugo FN. The Oral Health Impact Profile-14: a unidimensional scale? Cad Saude Publica 2013; 29: 749– 757. 21 Clark L, Watson D. Basic issues in objective scale development. Psychol Assess 1995; 7: 309–319. 22 John MT, Hujoel P, Miglioretti DL, LeResche L, Koepsell TD, Micheelis W. Dimensions of oral-health-related quality of life. J Dent Res 2004; 83: 956–960. 23 Brennan DS, Spencer AJ. Dimensions of oral health related quality of life measured by EQ-5D+ and OHIP-14. Health and Quality of Life Outcomes 2004; 2: 35. 24 Kuo HC, Chen JH, Wu JH, Chou TM, Yang YH. Application of the Oral Health Impact Profile (OHIP) among Taiwanese elderly. Qual Life Res 2011; 20: 1707–1713. 25 De Marchi RJ, Leal AF, Padilha DM, Brondani MA. Vulnerability and the psychosocial aspects of tooth loss in old age: a Southern Brazilian study. J Cross Cult Gerontol 2012; 27: 239–258. 26 Steele JG, Sanders AE, Slade GD et al. How do age and tooth loss affect oral health impacts and quality of life? A study comparing two national samples. Community Dent Oral Epidemiol 2004; 32: 107–114. © 2016 Japan Geriatrics Society 14470594, 2017, 2, Downloaded from https://onlinelibrary.wiley.com/doi/10.1111/ggi.12710 by Universidade Andres Bello, Wiley Online Library on [07/05/2023]. See the Terms and Conditions (https://onlinelibrary.wiley.com/terms-and-conditions) on Wiley Online Library for rules of use; OA articles are governed by the applicable Creative Commons License S León et al. 27 Sprangers MA, Schwartz CE. Integrating response shift into health-related quality of life research: a theoretical model. Soc Sci Med 1999; 48: 1507–1515. 28 Slade GD, Sanders AE. The paradox of better subjective oral health in older age. J Dent Res 2011; 90: 1279–1285. 29 Martins AB, Dos Santos CM, Hilgert JB, de Marchi RJ, Hugo FN, Pereira Padilha DM. Resilience and © 2016 Japan Geriatrics Society self-perceived oral health: a hierarchical approach. J Am Geriatr Soc 2011; 59: 725–731. 30 Brondani MA, MacEntee MI. The concept of validity in sociodental indicators and oral health-related quality-oflife measures. Community Dent Oral Epidemiol 2007; 35: 472– 478. | 285 14470594, 2017, 2, Downloaded from https://onlinelibrary.wiley.com/doi/10.1111/ggi.12710 by Universidade Andres Bello, Wiley Online Library on [07/05/2023]. See the Terms and Conditions (https://onlinelibrary.wiley.com/terms-and-conditions) on Wiley Online Library for rules of use; OA articles are governed by the applicable Creative Commons License Validation of the OHIP-7Sp
