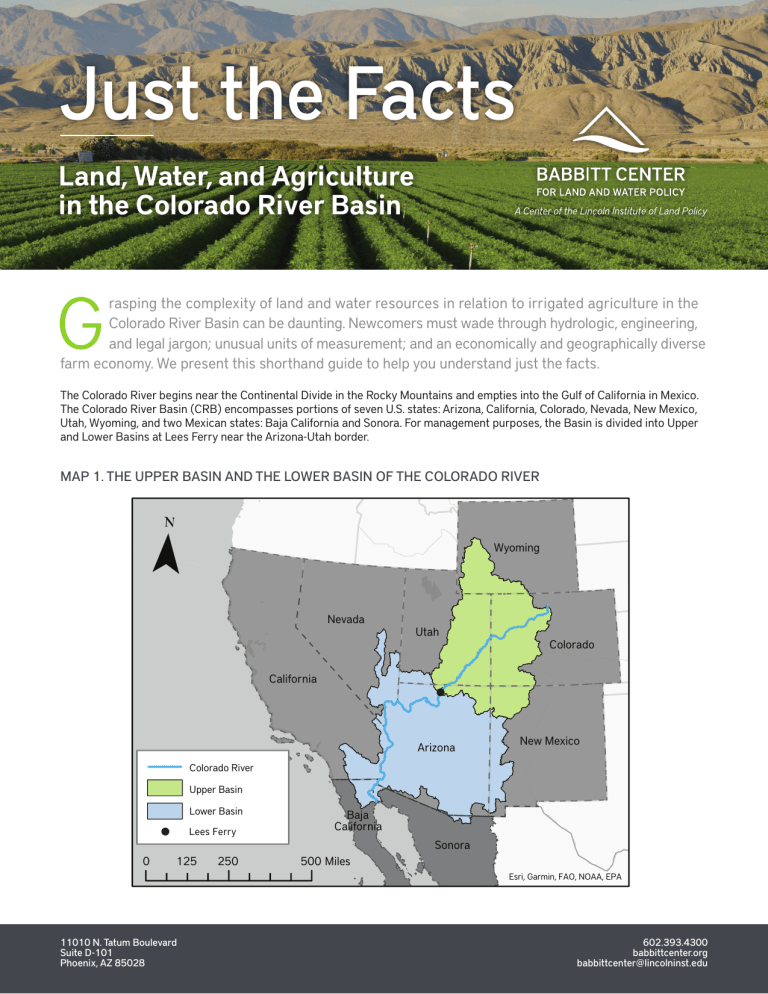
Just the Facts Land, Water, and Agriculture in the Colorado River Basin G rasping the complexity of land and water resources in relation to irrigated agriculture in the Colorado River Basin can be daunting. Newcomers must wade through hydrologic, engineering, and legal jargon; unusual units of measurement; and an economically and geographically diverse farm economy. We present this shorthand guide to help you understand just the facts. The Colorado River begins near the Continental Divide in the Rocky Mountains and empties into the Gulf of California in Mexico. The Colorado River Basin (CRB) encompasses portions of seven U.S. states: Arizona, California, Colorado, Nevada, New Mexico, Utah, Wyoming, and two Mexican states: Baja California and Sonora. For management purposes, the Basin is divided into Upper and Lower Basins at Lees Ferry near the Arizona-Utah border. MAP 1. THE UPPER BASIN AND THE LOWER BASIN OF THE COLORADO RIVER Wyoming Nevada Utah Colorado California Arizona New Mexico Colorado River Upper Basin Lower Basin Lees Ferry 0 125 250 Baja California Sonora 500 Miles Esri, Garmin, FAO, NOAA, EPA 11010 N. Tatum Boulevard Suite D-101 Phoenix, AZ 85028 602.393.4300 babbittcenter.org [email protected] MAP 2. FEDERAL DIVERSION PROJECTS DIVERT WATER FROM THE MAINSTEM OF THE COLORADO RIVER TO URBAN AND AGRICULTURAL AREAS (SHOWN IN DARK GREEN) AROUND AND OUTSIDE THE HYDROLOGIC BASIN. Colorado River Basin (CRB) Areas Served (AS) Major cities that use Colorado River water Colorado River Rivers in the CRB Cheyenne Salt Lake City Denver Las Vegas Santa Fe Albuquerque Los Angeles Phoenix Tucson 0 100 200 300 Miles Esri, HERE, Garmin, FAO, NOAA, USGS, EPA When accounting for water use and population it’s important to differentiate the hydrologic watershed of the River, which includes all its tributaries and is known as the Colorado River Basin, from the areas outside of the Basin, where Colorado River water is diverted to support urban populations and agriculture, shown as Areas Served (AS) in Map 2. The amount of Colorado River water diverted in each AS varies by area, time of year, and local surface water supply conditions. WATER RIGHTS—WHO IS ENTITLED TO WHAT? The prior appropriation doctrine is the primary method for managing water rights in the western United States. Under the doctrine, often called “first in time, first in right,” water rights are granted based on when (earliest date) the water right holder put water to beneficial use. A failure to use appropriated water for beneficial use within a reasonable amount of time can result in the loss of the water right. Annual allocations to the seven Basin states and Mexico are determined by a myriad of agreements and treaties, judicial rulings, statutes, regulations, and contracts since 1922 through today that are collectively referred to as the “Law of the River.” ANNUAL COLORADO RIVER WATER ALLOCATIONS The Upper Basin states combined may divert up to 7.5 million acre-fee (maf) based on available supply. • Colorado = 51.75% • Utah = 23% • Wyoming = 14% • New Mexico = 11.25% • Arizona* = 50,000 acre-feet (af) Lower Basin states allocations = 7.5 maf • California = 4.4 maf • Arizona* = 2.8 maf • Nevada = 0.3 maf Mexico = 1.5 maf * Regarding water allocations, Arizona is both an Upper and Lower Basin state. COLORADO RIVER FACTS 110,000 sq mi Upper Basin 1,450 mi Length of the Colorado River from the Continental Divide in Colorado to the Gulf of California 150,000 sq mi Lower Basin The Colorado River drains an area of about 260,000 square miles, about 1/12 of the United States 16,000 sq mi Areas Served, or AS Water is diverted to partially serve additional areas 45% 14.6 maf Historical average annual flow volume at Lees Ferry, AZ, in million acre-feet + 1 acre-foot is the equivalent to a football field (1 acre) covered by water to a depth of 1 foot, or 325,851 gallons 45% 90% of streamflow is generated in the Upper Basin, and half of that comes from groundwater through springs and connected underground aquifers BASIN FACTS 14.5 m 28.4 m Inside the Basin Highest point in the Basin: Uncompahgre Peak, CO, at 14,308 ft 50% Federal Land Federal land makes up ≈140,000 square miles of CRB + AS Lowest point in the Basin: Salton Trough, CA, at 235 ft below sea level 8% In the AS 42.9 million Estimated population receiving water from the Basin (2020) State Land 20% State land makes up ≈22,000 square miles of CRB + AS Tribal or Tribally owned land makes up ≈54,000 sq mi of CRB 2.5% ≈6,000 square miles of CRB + AS has been developed (2020) TRIBAL WATER FACTS 22% There are 30 federally recognized tribes in the CRB In Winters v. United States (1908), the Supreme Court first recognized tribal “reserved” water rights. Such rights are not measured by actual use and cannot be lost by nonuse 22 of the 30 Tribes in the Basin have a recognized right to use a combined 3.2 maf of Colorado River water annually, which amounts to 22% of the River’s average annual water supply. This amount does not include unrealized tribal claims that have yet to be adjudicated Race is the strongest predictor of water and sanitation access, and Native American households are 19 times more likely to lack indoor plumbing than white households in the United States Members of the Navajo Nation, the CRB’s largest reservation, are 67 times more likely than other Americans to lack access to running water, and an estimated 30–40% of Navajo Nation households haul water for daily needs AGRICULTURAL FACTS 0.5% 2.5% 15% 13% Approximately 70% of Colorado River water is used for agricultural purposes In 2020, ≈6,000 square miles of CRB + AS land was used for crop cultivation In 2020, ≈1,000 square miles of CRB + AS land is agricultural land that has been left fallow About 15% of the nation’s crops are produced and 13% of the nation’s livestock are raised in the CRB + AS More than half of the cropland and water use in the CRB is dedicated to feeding cattle and horses Alfalfa alone covers more than a quarter of the total irrigated acreage in the CRB Irrigated pasture and forge crops in the CRB consume more than 5 maf of water each year In 2019, agricultural production and processing industries represented 1.7% of Arizona’s GDP, with around $5 billion in agricultural cash receipts. The highest-value commodities were lettuce, dairy products, cattle, and calves. However, the estimated impact of agriculture on Arizona’s economy is about $23.3 billion $23.3B In 2020 the top five crops by acreage cultivated in the CRB were: Alfalfa Other Hay/ Non Alfalfa Cotton Corn Winter Wheat CRB 1,353,548 570,446 139,161 115,629 87,076 CRB + AS 1,698,262 739,952 139,201 410,404 227,936 WATER STORAGE FACTS Storage is integral to the management of the River, including how the shortage of water is shared among all parties 37 28% capacity 34% capacity Reservoirs on the mainstem Colorado River can store approximately 60 maf, or up to about four times the average annual flow volume. Throughout the entire basin 37 large reservoirs collectively store over 77 maf Lake Powell, the second-largest reservoir in the United States, with 26.2 maf of storage capacity, stores water for the Upper Basin Lake Mead, the largest reservoir in the United States, with 28.2 maf of storage capacity, stores water for the Lower Basin Capacity as of January 1, 2022 Sources for the data in this report can be found at lincolninst.edu/jtfsources About the Babbitt Center for Land and Water Policy The Babbitt Center for Land and Water Policy, a center of the Lincoln Institute of Land Policy, was established to advance the integration of land and water management to meet the current and future water needs of Colorado River Basin communities, economies, and the environment. Get Involved As communities strive to adopt policies that integrate land use and water planning, the Babbitt Center seeks to collaborate with respected organizations to advance water sustainability throughout the West. To join the conversation, contact us. 11010 N. Tatum Boulevard Suite D-101 Phoenix, AZ 85028 602.393.4300 babbittcenter.org [email protected]
![Presentacion Chile - Canada [Modo de compatibilidad]](http://s2.studylib.es/store/data/006031439_1-d894d5d2d359230b5c2007cc916df922-300x300.png)
