Cangrejos herradura y regresión logıstica múltiple 20 de enero de
Anuncio
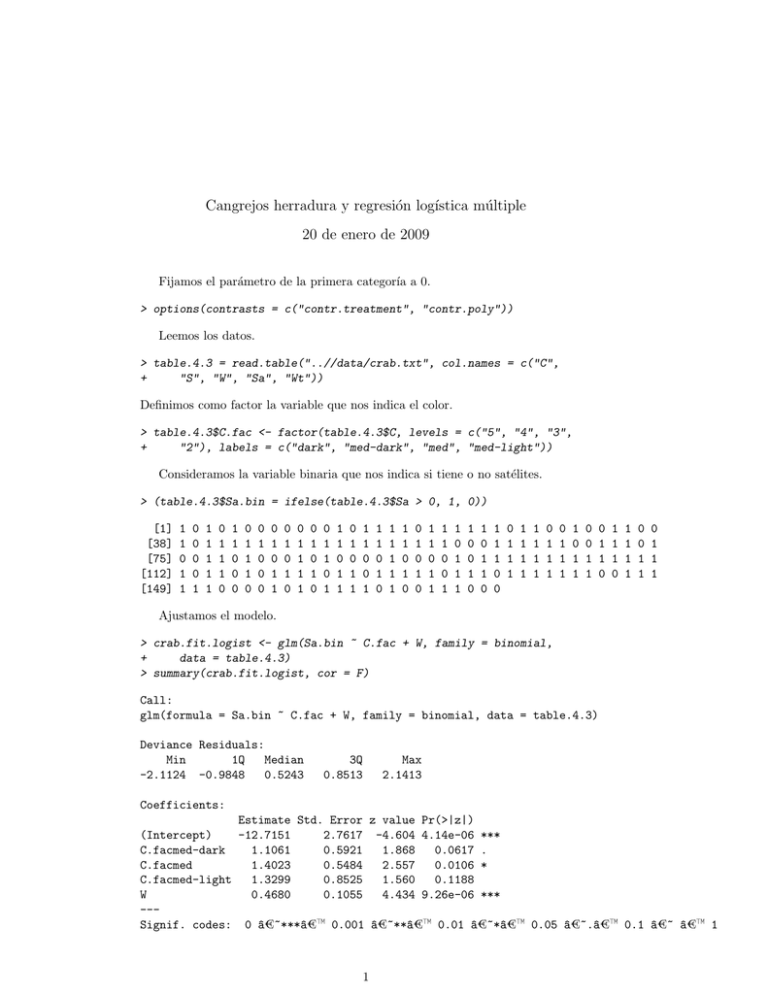
Cangrejos herradura y regresión logı́stica múltiple 20 de enero de 2009 Fijamos el parámetro de la primera categorı́a a 0. > options(contrasts = c("contr.treatment", "contr.poly")) Leemos los datos. > table.4.3 = read.table("..//data/crab.txt", col.names = c("C", + "S", "W", "Sa", "Wt")) Definimos como factor la variable que nos indica el color. > table.4.3$C.fac <- factor(table.4.3$C, levels = c("5", "4", "3", + "2"), labels = c("dark", "med-dark", "med", "med-light")) Consideramos la variable binaria que nos indica si tiene o no satélites. > (table.4.3$Sa.bin = ifelse(table.4.3$Sa > 0, 1, 0)) [1] [38] [75] [112] [149] 1 1 0 1 1 0 0 0 0 1 1 1 1 1 1 0 1 1 1 0 1 1 0 0 0 0 1 1 1 0 0 1 0 0 0 0 1 0 1 1 0 1 0 1 0 0 1 1 1 1 0 1 0 1 0 0 1 1 0 1 1 1 0 1 1 0 1 0 1 1 1 1 0 0 1 1 1 0 1 0 1 1 1 1 1 1 1 0 1 0 0 1 0 1 0 1 1 0 1 1 1 1 0 0 1 1 0 1 1 1 1 0 0 1 0 1 0 1 1 0 1 1 1 0 0 0 1 1 1 1 1 1 1 1 1 1 1 0 1 1 1 0 1 1 1 1 0 1 1 0 0 1 1 0 1 1 0 1 1 1 0 1 1 1 1 0 0 1 1 0 1 1 1 Ajustamos el modelo. > crab.fit.logist <- glm(Sa.bin ~ C.fac + W, family = binomial, + data = table.4.3) > summary(crab.fit.logist, cor = F) Call: glm(formula = Sa.bin ~ C.fac + W, family = binomial, data = table.4.3) Deviance Residuals: Min 1Q Median -2.1124 -0.9848 0.5243 3Q 0.8513 Max 2.1413 Coefficients: Estimate Std. Error z value Pr(>|z|) (Intercept) -12.7151 2.7617 -4.604 4.14e-06 *** C.facmed-dark 1.1061 0.5921 1.868 0.0617 . C.facmed 1.4023 0.5484 2.557 0.0106 * C.facmed-light 1.3299 0.8525 1.560 0.1188 W 0.4680 0.1055 4.434 9.26e-06 *** --Signif. codes: 0 ^ a€~***^ a€™ 0.001 ^ a€~**^ a€™ 0.01 ^ a€~*^ a€™ 0.05 ^ a€~.^ a€™ 0.1 ^ a€~ ^ a€™ 1 1 (Dispersion parameter for binomial family taken to be 1) Null deviance: 225.76 Residual deviance: 187.46 AIC: 197.46 on 172 on 168 degrees of freedom degrees of freedom Number of Fisher Scoring iterations: 4 Veamos los intervalos de confianza. > library(MASS) > confint(crab.fit.logist) 2.5 % 97.5 % (Intercept) -18.45674069 -7.5788795 C.facmed-dark -0.02792233 2.3138635 C.facmed 0.35269965 2.5260703 C.facmed-light -0.27377584 3.1356611 W 0.27128167 0.6870436 Predicciones. > + > + > + > + > + > > > > > > > > > > + > > + > res1 = predict(crab.fit.logist, type = "response", newdata = data.frame(W = seq(18, 34, 1), C.fac = "med-light")) res2 = predict(crab.fit.logist, type = "response", newdata = data.frame(W = seq(18, 34, 1), C.fac = "med")) res3 = predict(crab.fit.logist, type = "response", newdata = data.frame(W = seq(18, 34, 1), C.fac = "med-dark")) res4 = predict(crab.fit.logist, type = "response", newdata = data.frame(W = seq(18, 34, 1), C.fac = "dark")) plot(seq(18, 34, 1), res1, type = "l", bty = "L", ylab = "Predicted Probability", axes = F, xlab = expression(paste("Width, ", italic(x), "(cm)"))) axis(2, at = seq(0, 1, 0.2)) axis(1, at = seq(18, 34, 2)) lines(seq(18, 34, 1), res2) lines(seq(18, 34, 1), res3) lines(seq(18, 34, 1), res4) arrows(x0 = 29, res1[25 - 17], x1 = 25, y1 = res1[25 - 17], length = 0.09) text(x = 29.1, y = res1[25 - 17], "Color 1", adj = c(0, 0)) arrows(x0 = 23, res2[26 - 17], x1 = 26, y1 = res2[26 - 17], length = 0.09) text(x = 21.1, y = res2[26 - 17], "Color 2", adj = c(0, 0)) arrows(x0 = 28.9, res3[24 - 17], x1 = 24, y1 = res3[24 - 17], length = 0.09) text(x = 29, y = res3[24 - 17], "Color 3", adj = c(0, 0)) arrows(x0 = 25.9, res4[23 - 17], x1 = 23, y1 = res4[23 - 17], length = 0.09) text(x = 26, y = res4[23 - 17], "Color 4", adj = c(0, 0)) 2 1.0 0.8 0.6 Color 1 0.4 Color 3 0.2 Predicted Probability Color 2 Color 4 18 20 22 24 26 28 30 32 34 Width, x(cm) Consideramos un modelo con interacción color y anchura del caparazón. > crab.fit.logist.ia = update(object = crab.fit.logist, formula = ~. + + W:C.fac) > anova(crab.fit.logist, crab.fit.logist.ia, test = "Chisq") Analysis of Deviance Table Model 1: Sa.bin ~ C.fac + W Model 2: Sa.bin ~ C.fac + W + C.fac:W Resid. Df Resid. Dev Df Deviance P(>|Chi|) 1 168 187.457 2 165 183.081 3 4.376 0.224 No parece razonable considerar interacción. 3
