Personalizing the reference level: Gold standard to evaluate the
Anuncio
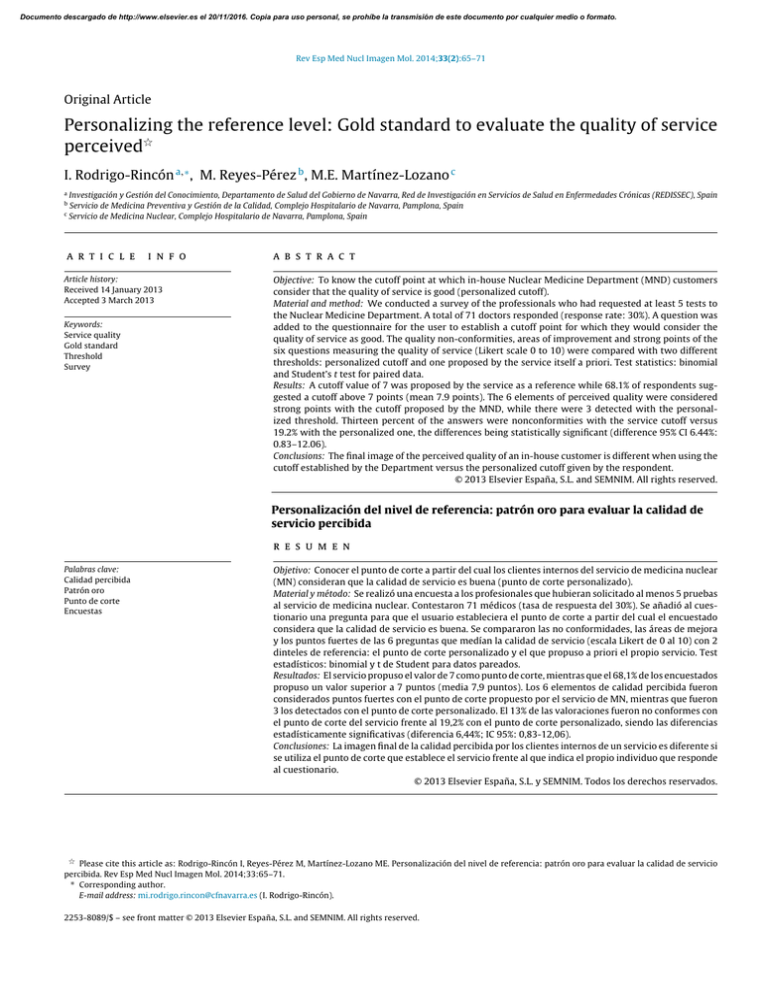
Documento descargado de http://www.elsevier.es el 20/11/2016. Copia para uso personal, se prohíbe la transmisión de este documento por cualquier medio o formato. Rev Esp Med Nucl Imagen Mol. 2014;33(2):65–71 Original Article Personalizing the reference level: Gold standard to evaluate the quality of service perceived夽 I. Rodrigo-Rincón a,∗ , M. Reyes-Pérez b , M.E. Martínez-Lozano c a Investigación y Gestión del Conocimiento, Departamento de Salud del Gobierno de Navarra, Red de Investigación en Servicios de Salud en Enfermedades Crónicas (REDISSEC), Spain Servicio de Medicina Preventiva y Gestión de la Calidad, Complejo Hospitalario de Navarra, Pamplona, Spain c Servicio de Medicina Nuclear, Complejo Hospitalario de Navarra, Pamplona, Spain b a r t i c l e i n f o Article history: Received 14 January 2013 Accepted 3 March 2013 Keywords: Service quality Gold standard Threshold Survey a b s t r a c t Objective: To know the cutoff point at which in-house Nuclear Medicine Department (MND) customers consider that the quality of service is good (personalized cutoff). Material and method: We conducted a survey of the professionals who had requested at least 5 tests to the Nuclear Medicine Department. A total of 71 doctors responded (response rate: 30%). A question was added to the questionnaire for the user to establish a cutoff point for which they would consider the quality of service as good. The quality non-conformities, areas of improvement and strong points of the six questions measuring the quality of service (Likert scale 0 to 10) were compared with two different thresholds: personalized cutoff and one proposed by the service itself a priori. Test statistics: binomial and Student’s t test for paired data. Results: A cutoff value of 7 was proposed by the service as a reference while 68.1% of respondents suggested a cutoff above 7 points (mean 7.9 points). The 6 elements of perceived quality were considered strong points with the cutoff proposed by the MND, while there were 3 detected with the personalized threshold. Thirteen percent of the answers were nonconformities with the service cutoff versus 19.2% with the personalized one, the differences being statistically significant (difference 95% CI 6.44%: 0.83–12.06). Conclusions: The final image of the perceived quality of an in-house customer is different when using the cutoff established by the Department versus the personalized cutoff given by the respondent. © 2013 Elsevier España, S.L. and SEMNIM. All rights reserved. Personalización del nivel de referencia: patrón oro para evaluar la calidad de servicio percibida r e s u m e n Palabras clave: Calidad percibida Patrón oro Punto de corte Encuestas Objetivo: Conocer el punto de corte a partir del cual los clientes internos del servicio de medicina nuclear (MN) consideran que la calidad de servicio es buena (punto de corte personalizado). Material y método: Se realizó una encuesta a los profesionales que hubieran solicitado al menos 5 pruebas al servicio de medicina nuclear. Contestaron 71 médicos (tasa de respuesta del 30%). Se añadió al cuestionario una pregunta para que el usuario estableciera el punto de corte a partir del cual el encuestado considera que la calidad de servicio es buena. Se compararon las no conformidades, las áreas de mejora y los puntos fuertes de las 6 preguntas que medían la calidad de servicio (escala Likert de 0 al 10) con 2 dinteles de referencia: el punto de corte personalizado y el que propuso a priori el propio servicio. Test estadísticos: binomial y t de Student para datos pareados. Resultados: El servicio propuso el valor de 7 como punto de corte, mientras que el 68,1% de los encuestados propuso un valor superior a 7 puntos (media 7,9 puntos). Los 6 elementos de calidad percibida fueron considerados puntos fuertes con el punto de corte propuesto por el servicio de MN, mientras que fueron 3 los detectados con el punto de corte personalizado. El 13% de las valoraciones fueron no conformes con el punto de corte del servicio frente al 19,2% con el punto de corte personalizado, siendo las diferencias estadísticamente significativas (diferencia 6,44%; IC 95%: 0,83-12,06). Conclusiones: La imagen final de la calidad percibida por los clientes internos de un servicio es diferente si se utiliza el punto de corte que establece el servicio frente al que indica el propio individuo que responde al cuestionario. © 2013 Elsevier España, S.L. y SEMNIM. Todos los derechos reservados. 夽 Please cite this article as: Rodrigo-Rincón I, Reyes-Pérez M, Martínez-Lozano ME. Personalización del nivel de referencia: patrón oro para evaluar la calidad de servicio percibida. Rev Esp Med Nucl Imagen Mol. 2014;33:65–71. ∗ Corresponding author. E-mail address: [email protected] (I. Rodrigo-Rincón). 2253-8089/$ – see front matter © 2013 Elsevier España, S.L. and SEMNIM. All rights reserved. Documento descargado de http://www.elsevier.es el 20/11/2016. Copia para uso personal, se prohíbe la transmisión de este documento por cualquier medio o formato. 66 I. Rodrigo-Rincón et al. / Rev Esp Med Nucl Imagen Mol. 2014;33(2):65–71 Introduction 50 43.9 45 Material and methods The framework of the sample was made up of professionals from the clinical departments of a tertiary level hospital requesting tests or consultations from the DNM. The subjects constituting the sample were physicians from other departments who had requested at least 5 tests from the DNM in 2010. On identifying these professionals they were sent a questionnaire designed to evaluate the quality of service provided by the DNM (Annex 1). Two modalities of questionnaire completion were provided. The questionnaire in paper form was sent to each professional by internal mail of the hospital together with an envelope for returning the questionnaire. In addition, the professionals were sent an email with a link in order to answer the questionnaire anonymously. They were told that the two modalities were incompatible. Two reminders were sent. The collection period of the 40 % of answers One of the most relevant elements for improvement in the quality of organizations is knowing the satisfaction and the quality of the services perceived by the consumers.1–3 Although the concepts of satisfaction and service quality service are apparently simple, there is no consensus with regard to their meaning or how to conceptualize the relationship between satisfaction and the quality of the service provided or the most correct method for their measurement.3 Nonetheless, most institutions use some type of tool for their measurement.4 The method most frequently used to measure both satisfaction as the service quality is with questionnaires.5,6 Most questionnaires use scales following a structure of Likert-type response with a series of categories of response along the continuum “favorable/unfavorable”. On numerous occasions, the question only indicates the meaning of the initial and final points with intermediate values remaining unspecified. One example of this is question number 3 of the healthcare barometer which asks: “Are you satisfied or dissatisfied with the way in which the public healthcare system works in Spain?” To answer, the individual is shown a card with numbers from 1 to 10, with 1 corresponding to very dissatisfied and 10 to satisfied,7 without specifying the intermediate values. Analysis of the results of questions with this type of scale is not simple. How can the cutoff or reference value to be considered as a good result be determined? Above what score should the institution consider an aspect as a strong point or at what value is there an area of improvement? To answer this question different approaches have been used such as the determination of an objective value from a benchmark8 or a desired value. That is, users are asked about their perception of an aspect with the aim of involving the users in the evaluation of a department, but the interpretation of the results is performed with a subjective aim established by the service provider. To measure the service quality other authors9,10 have used the model of discrepancies or “gaps” model comparing the perceptions of the user with respect to their expectations. In the present study we considered an alternative to the setting of a subjective cutoff point by the Department of Nuclear Medicine (DNM). The proposal consisted in having the internal customers requiring tests from the DNM themselves establish the cutoff at which the quality perceived is deemed good. We compared the strong points, the areas of improvement detected and those discrepant with 2 reference levels, that proposed by the DNM and the internal consumers. The objective was to determine the cutoff at which the internal consumers of the DNM consider the service quality as good. 35 30 25.8 25 19.7 20 15 10 6.1 5 4.5 0 1 2 3 4 5 6 Scores 7 8 9 10 Fig. 1. Distribution of the frequencies of the score given to the question “Above what score do you consider that the service quality is good?”. questionnaires was from June to September, 2011. Of a total of 237 professionals, 71 answered (30% response rate). The questionnaire consisted of 14 items, 6 of which involved items related to the quality of the services. The scale used for the questions ranged from 0 (worst possible score) to 10 (best possible score). The reliability of the questionnaire measured with the Cronbach alpha coefficient was of 0.643, with the general alpha value with typified items being 0.790. At the end of the questionnaire there was an item asking the professional to state at what numerical score they would consider the service quality as good, considering this score as a personalized cutoff. Prior to the incorporation of the item to the questionnaire, 5 interviews of professionals were undertaken to perform cognitive validation of the question and thereby confirm that the statement was correct and comprehensible. Prior to the analysis of the results the DNM was requested to set a cutoff at which they considered that the service quality provided was good. By consensus the department determined the cutoff of 7 and this value was denominated the “department cutoff”. An element evaluated was considered as a strong point of the department if its lowest value of the confidence interval of 95% was greater than the reference level, and an area of improvement was considered if the highest value of the confidence interval of 95% was lower than the value of this level. Using the personalized cutoff the number of discrepancies was calculated by the difference between the score given to each question and the value at which the subject considered that the service quality was good. For example, if an individual gave an item referring to the service quality the reports 8 points and considered that 9 was the score that should be obtained to provide good quality service, we have a value of −1 point (8 minus 9). All the negative values such as the example indicated were considered to be discrepant. Likewise, the number of discrepancies was calculated applying the value of 7 as the threshold of reference. This value was what had been established by the DNM. The statistical tests used included the binomial method for dependent samples and Student’s t test for paired data. Results Table 1 shows the results of the analysis of the items measuring the service quality. With regard to the question “Above what score do you consider that the service quality is good?” 68.1% of the subjects gave a value greater than 7. That is, the level of reference established a priori by the service was below the reference level given by many of the professionals (Fig. 1). Documento descargado de http://www.elsevier.es el 20/11/2016. Copia para uso personal, se prohíbe la transmisión de este documento por cualquier medio o formato. I. Rodrigo-Rincón et al. / Rev Esp Med Nucl Imagen Mol. 2014;33(2):65–71 67 Table 1 Results of the items referring to the quality of service together with the question threshold. Item Mean (CI 95%) SD Minimum Maximum Attitude to collaborate in organizational problems Speed in the performance of tests/consultation Speed in emitting reports Reports quality Information on criteria for not performing tests Capacity of resolution Satisfaction with DNM Recommendation of service to other professionals Score at which the service quality may be considered good 8.34 (7.77–8.91) 7.96 (7.557–8.36) 8.33 (7.97–8.7) 8.79 (8.46–9.13) 7.93 (7.06–8.80) 8.51 (8.22–8.80) 8.89 (8.60–9.19) 8.67 (8.31–9.02) 7.91 (7.68–8.14) 1.81 1.64 1.48 1.27 2.24 1.15 1.12 1.14 0.75 1 4 4 5 1 6 6 6 6 10 10 10 10 10 10 10 10 10 Analysis of the results from the mean thresholds of reference One of the fundamental objectives of the study was to know the strong points and areas of improvement in the DNM. On analyzing the results of each of the questions we found that of the 6 questions measuring the quality of the service all were strong points with the cutoff set by the department while 3 were not so on considering the mean personalized cutoff (Fig. 2). No areas of improvement were detected with either of the 2 methods used since the confidence interval was not below the levels established for any variable. The axis of ordinates was from −10 to +10, being the range of possible scores. No element was given a mean negative value indicating that the scores of quality perceived by the professionals were higher than the cutoff set by themselves or that established by the DNM (value 7). Nonetheless, on comparing the mean values of all the elements evaluated, statistically significant differences were observed on comparing the 2 cutoffs, with the mean differences for threshold 7 being greater than for the personalized cutoff (p < 0.05, Student’s t test for paired data). Discussion Analysis of the disagreement with each item evaluated The number and percentage of discrepancies per question with both cutoffs are shown in Table 2. Using the personalized cutoff a total of 62 discrepancy values (19.2%) were detected while the mean cutoff of the department detected 41 (13%), with these differences being statistically significant (difference: 6.44%; CI 95%: 0.83–12.06). No statistically significant differences were observed in the item by item analysis. The mean values for each item of the variables “difference in perception with regard to the personalized cutoff” and “difference in perception with respect to the department cutoff” are shown in Fig. 3. The main objectives on undertaking a questionnaire of the quality of service perceived are to determine the strong points and the areas of improvement from the point of view of those surveyed. However, the methodology used for the analysis of the results, and thus, the interpretation of these results is conditioned by the type of scale of the variables and the cutoff established for evaluation. The analysis of the results indicates that the interpretation of the strong points differs based on the method used. Of the 6 items measuring the quality of service all were considered strong points from the cutoff set by the DNM while only 3 were considered strong points with the personalized cutoff. There were no discrepancies with regard to the areas of improvement, with none being detected 10 9 8 8.8 8.3 8.5 8.3 8.0 Threshold surveyed 7.9 7 Threshold purveyor Scores 6 5 4 3 2 1 Attitude to collaborate in organizational problems Speed in the performance of tests/consultation Speed in emitting reports Report quality Information on criteria for not performing tests Evaluated items Fig. 2. Mean values and confidence intervals of 95% of the items referring to the service quality. Capacity of resolution Documento descargado de http://www.elsevier.es el 20/11/2016. Copia para uso personal, se prohíbe la transmisión de este documento por cualquier medio o formato. 68 I. Rodrigo-Rincón et al. / Rev Esp Med Nucl Imagen Mol. 2014;33(2):65–71 Table 2 Analysis of discrepancies: individual threshold and threshold established by the department of nuclear medicine. Item n Attitude to collaborate in organizational problems Speed in the performance of tests/consultations Speed in emitting reports Reports quality Information on criteria for not performing tests Capacity of resolution Total 41 67 66 58 28 63 323 Individual threshold DNM threshold No. of discrepancies % % over total of discrepancies No. of discrepancies % % over total of discrepancies 8 20 15 5 6 8 62 19.5 29.9 22.7 8.6 21.4 12.7 19.2 12.9 32.3 24.2 8.1 9.7 12.9 100 5 15 11 4 3 3 41 12.2 22.4. 16.7 6.9 10.7 4.8 13.0 12.2 36.6 26.8 9.8 7.3 7.3 100 n indicates the number of persons answering each item of the questionnaire; % indicates the percentage of individuals considering discrepancy with this item; % over the total of discrepancies indicates what percentage of the total of discrepancies corresponds to each item. 10.00 8.00 6.00 4.00 1.34 2.00 0.05 0.00 Service attitude 1.79 1.33 0.96 0.58 Test speed 0.41 Report speed 1.51 0.93 1.00 0.08 Report quality 0.63 Inf. not perform test –2.00 Capacity of resolution –4.00 –6.00 –8.00 –10.00 Individual threshold Threshold 7 Fig. 3. Quality of service: mean values of the differences between perceptions and the threshold of reference. independently of the method used. That is, when the cutoff was established by the evaluator, fewer strong points were detected than those that would have been detected by the DNM using its own threshold. Similarly, a greater number of discrepancies were detected on using the personalized cutoff versus the department cutoff, with the differences being statistically significant. Likewise, on calculating the difference between the mean values of quality perceived given and the reference levels, the values obtained were significantly higher for the department than for the personalized cutoff in all the items. The discrepancy as to the areas of improvement and strong points and the number of discrepancies varied based on how far the personalized cutoff was from the other threshold established. The problem is that since the user is not consulted with regard to the value at which the quality of service may be considered as good, the error committed in the interpretation of the results is not known. Nonetheless, regardless of the results obtained, from a conceptual point of view the reference cutoff and thus, the gold standard, should be that indicated by the subject responding to the questionnaire. On the other hand, analysis of the differences or discrepancies is not a new method since this has been used since the 1980s. The discrepancy method considers that the evaluation of quality is the result of the divergence between perceptions and expectations.7,10–12 The method proposed in this study differs from the discrepancy models such as that by Parasuraman et al.10 in 2 ways. The first is that with the methodology which we used expectations were not considered. The debate regarding the measurement of expectations is explained in other studies.13–15 Nevertheless, the detractors of the discrepancy model indicate that the inclusion of expectations may be inefficient and unnecessary because individuals tend to indicate high levels of expectation and thus, the values of perception are rarely surpassed. Secondly, with our method it is not necessary for the subject to provide a level of reference for each item. It is therefore not necessary to duplicate the number of items made but rather to add one more question to the questionnaire. To avoid duplicity of items, other authors16 have used a questionnaire in which the scale of response combines expectations and perceptions. With respect to the type of scale, polytomous variables allow relatively simple classification of the categories referring to the discrepancies. Nonetheless, many organizations use an ordinal scale in which only the final cutoffs of the scale are set. This option presents some inconveniences. First, the use of digits – numbers – does not guarantee adequate psychometric properties for using the usual statistical tests. Second, there is the problem of defining a reference threshold of a cutoff at which a strong point or area of improvement may be considered. Documento descargado de http://www.elsevier.es el 20/11/2016. Copia para uso personal, se prohíbe la transmisión de este documento por cualquier medio o formato. I. Rodrigo-Rincón et al. / Rev Esp Med Nucl Imagen Mol. 2014;33(2):65–71 The method described takes into account the opinion of the subjects surveyed when setting the level of reference versus other systems in which it is the service purveyor who subjectively establishes this value, often a posteriori and after knowing the results. That is, grant the value of judgment to the individual, which is, on the other hand, implicit when wishing to obtain the user’s opinion of the quality of service. In addition, most studies published focus on the evaluation by patients, with studies centered on assessment by professionals being less frequent. This study did not ask patients about the quality of service but rather the professionals requesting tests or consultations to the DNM and thus, these results cannot be extrapolated to patients, although the conceptual basis is the same. The DNM considered the cutoff to be 7 because the professionals are, in general, less generous in giving scores than patients.17 The cutoff set by the DNM would have been higher if the quality perceived was to have been evaluated by the patients. Comparative data of cutoffs given by users (internal or external consumers) in other studies are not provided since we did not find any article applying this type of focus. 69 In summary, the novelty of this study lays in that it proposes that the users who respond to the questionnaire should establish the cutoff at which the quality is perceived to be good since the final image of quality perceived by the internal consumers of a department is different if the cutoff set by the department is used versus that indicated by the individuals responding to the questionnaires. Author contribution M. Isabel Rodrigo Rincón participated in all the phases of article preparation including the design, data analysis and redaction. María Reyes Pérez participated in the field work and data analysis. M. Eugenia Martínez contributed to the conception and design of the study as well as the approval of the final version for publication. Conflict of interests The authors declare no conflict of interests. Annex 1. Questionnaire to internal consumers This questionnaire has the objective to know your opinion on the global quality of all the actions of the Department of Nuclear Medicine. The aim of this questionnaire is to know the “image of competence” of the specialty of Nuclear Medicine to detect aspects which will allow us to continue improving. Please put a cross on the option which best reflects your opinion as a professional. If you make a mistake, cross out the incorrect option and place another cross on the option you consider the most adequate. Please remember that all the questions are aspects which you would expect from the specialty of Nuclear Medicine. To respond, please use the questionnaire below. Thank you for your collaboration. P1- The degree of relationship between the department to which you belong and the Department o Nuclear Medicine (evaluated by the need for this department in your usual practice: number of patients undergoing tests, number of tests requested, importance the tests requested have for your department in relation to correct diagnosis or treatment of the patients...): No relationship □ Low relationship □ Moderate relationship □ Very close relationship □ P2- Approximately how many tests do you request from the Department of Nuclear Medicine per year? Less than □ From 5 to 9 □ From 10 to 15 □ More than 15 □ Please circle the option most closely approaching your perception of each of the following statements. The score ranges from ZERO (minimum possible score) to TEN (maximum possible score). P3- Evaluate the attitude of the Department of Nuclear Medicine in collaborating with you in the resolution of organizational problems (patient management, channels or circuits of communication for data of clinical relevance, etc.). 0 None 1 2 3 4 5 6 7 8 9 NA 10 Excellent P4-The speed of the performance of the tests/consultations of the Department of Nuclear Medicine is (from the time of the request to the performance of the test). 0 1 Very slow 2 3 4 5 6 7 8 9 NA 10 Very fast Documento descargado de http://www.elsevier.es el 20/11/2016. Copia para uso personal, se prohíbe la transmisión de este documento por cualquier medio o formato. 70 I. Rodrigo-Rincón et al. / Rev Esp Med Nucl Imagen Mol. 2014;33(2):65–71 P5 -The reports, registries or results of the tests/(consultations emitted by the Department of Nuclear Medicine with regard to: P5-1 The speed (from the time of the test/consultation to the emission of the results) 0 1 2 3 4 5 6 7 8 9 Very slow 10 NA Very fast P5-2- The quality you perceive of the reports or results: 0 1 Very bad 2 3 4 5 6 7 8 9 NA 10 Very good P6- When the Department of Nuclear Medicine decides not to carry out the test requested for a patient from your department please score from 0 to 10 the information provided in relation to the criteria for not performing the test. 0 1 2 No criteria 3 4 5 6 7 8 9 10 NA Excellent P7- Assess the capacity of resolution of the Department of Nuclear Medicine for the patients referred by yourself. 0 1 Very low 2 3 4 5 6 7 8 9 10 NA Very high P8- In your opinion, evaluate from 0 to 10 the quantity of human resources available in the Department of Nuclear Medicine to perform their work. 0 1 Very scarce 2 3 4 5 6 7 8 9 10 NA Very abundant P9- In your opinion evaluate from 0 to 10 the technological resources available in the Department of Nuclear Medicine to perform their work. 0 1 2 Very precarious 3 4 5 6 7 8 9 10 NA Excellent P10- ¿What IMAGE do you have of the professional competence of the staff of the Department of Nuclear Medicine? 0 1 Very bad 2 3 4 5 6 7 8 9 10 NA Excellent P11- As a whole, evaluate your satisfaction with the Department of Nuclear Medicine. 0 1 Very low 2 3 4 5 6 7 8 9 10 NA Very high P12 Would you recommend the Department of Nuclear Medicine to other professionals if they were in the same situation and could choose a department? 0 Never 0 1 2 3 4 5 6 7 8 9 10 NA Always P13- In each of the questions of the questionnaire, Above what score do you consider that the service quality is good? NA 1 2 3 4 5 6 7 8 9 10 P14- Would you like to add any comment concerning any aspect related to the Department of Nuclear which was not included in the questions above? _____________________________________________________________________________________ _____________________________________________________________________________________ _____________________________________________________________________________________ _____________________________________________________________________________________ Documento descargado de http://www.elsevier.es el 20/11/2016. Copia para uso personal, se prohíbe la transmisión de este documento por cualquier medio o formato. I. Rodrigo-Rincón et al. / Rev Esp Med Nucl Imagen Mol. 2014;33(2):65–71 References 1. Garcia Vicente A, Soriano Castrejón A, Martínez Delgado C, Poblete García VM, Ruiz Solís S, Cortés Romera M, et al. La satisfacción del usuario como indicador de calidad en un servicio de Medicina Nuclear. Rev Esp Med Nucl. 2007;26: 146–52. 2. Poblete García VM, Talavera Rubio MP, Palomar Muñoz A, Pilkington Woll JP, Cordero García JM, García Vicente AM, et al. Implantación de un sistema de Gestión de Calidad según norma UNE-UN-ISO 9001:2008 en un Servicio de Medicina Nuclear. Rev Esp Med Nucl Imagen Mol. 2013;32:1–7. 3. Gill L, White L. A critical review of patient satisfaction. Leadersh Health Serv (Bradf Engl). 2009;22:8–19. 4. Crowe R, Gage H, Hampson S, Hart J, Kimber A, Storey L, et al. The measurement of satisfaction with healthcare: implications for practice from a systematic review of the literature. Health Technol Assess. 2002;6:1–244. 5. Mira JJ, Aranaz J. La satisfacción del paciente como una medida del resultado de la atención sanitaria. Med Clin (Barc). 2000;114 Suppl. 3:26–33. 6. Reyes-Pérez M, Rodrigo-Rincón MI, Martínez-Lozano ME, Goñi-Gironés E, Camarero-Salazar A, Serra-Arbeloa P, et al. Evaluación del grado de satisfacción de los pacientes atendidos en un servicio de Medicina Nuclear. Rev Esp Med Nucl Imagen Mol. 2012;31:192–201. 7. Cuestionario del Barómetro Sanitario utilizado por el Ministerio de Sanidad, Servicios Sociales e Igualdad. 2011 [accessed 30.11.12]. Available in: http:// www.msps.es/estadEstudios/estadisticas/docs/BS 2011 Cuestionario.pdf 71 8. Rodrigo-Rincón I, Viñes JJ, Guillén-Grima F. Análisis de la calidad de la información proporcionada a los pacientes por parte de unidades clínicas especializadas ambulatorias mediante análisis por modelos multinivel. An Sist Sanit Navar. 2009;32:183–97. 9. Parasuraman A, Zeithaml V, Berry L. Reassessment of expectations as a comparison standard in measuring service quality: implications for future research. J Mark. 1994;58:111–24. 10. Parasuraman A, Zeithaml V, Berry L. SERVQUAL. A multiple-item scale for measuring consumer perceptions for service quality. J Retail. 1988;64:12–40. 11. Oliver RL. A cognitive model of the antecedents and consequences of satisfaction decisions. J Mark Res. 1980;17:460–9. 12. Grönroos C. A service quality model and its marketing implications. Eur J Mark. 1984;18:6–44. 13. Babakus E, Boller GW. An empirical assessment of the SERVQUAL scale. J Bus Res. 1992;24:253–68. 14. Cronin JJ, Taylor S. Measuring service quality: a re-examination and extension. J Mark. 1992;56:55–68. 15. Thompson AG, Suñol R. Expectations as determinants of patient satisfaction: concepts, theory and evidence. Int J Qual Health Care. 1995;7:127–41. 16. Mira JJ, Aranaz J, Rodríguez-Marín J, Buil JA, Castell M, Vitaller J. SERVQHOS, un cuestionario para evaluar la calidad percibida. Med Prev. 1998;4:12–8. 17. de Man S, Gemmel P, Vlerick P, Van Rijk P, Dierckx R. Patients’ and personnel’s perceptions of service quality and patient satisfaction in nuclear medicine. Eur J Nucl Med Mol Imaging. 2002;29:1109–17.
