towards a typology of countries according to their greenhouse gases
Anuncio
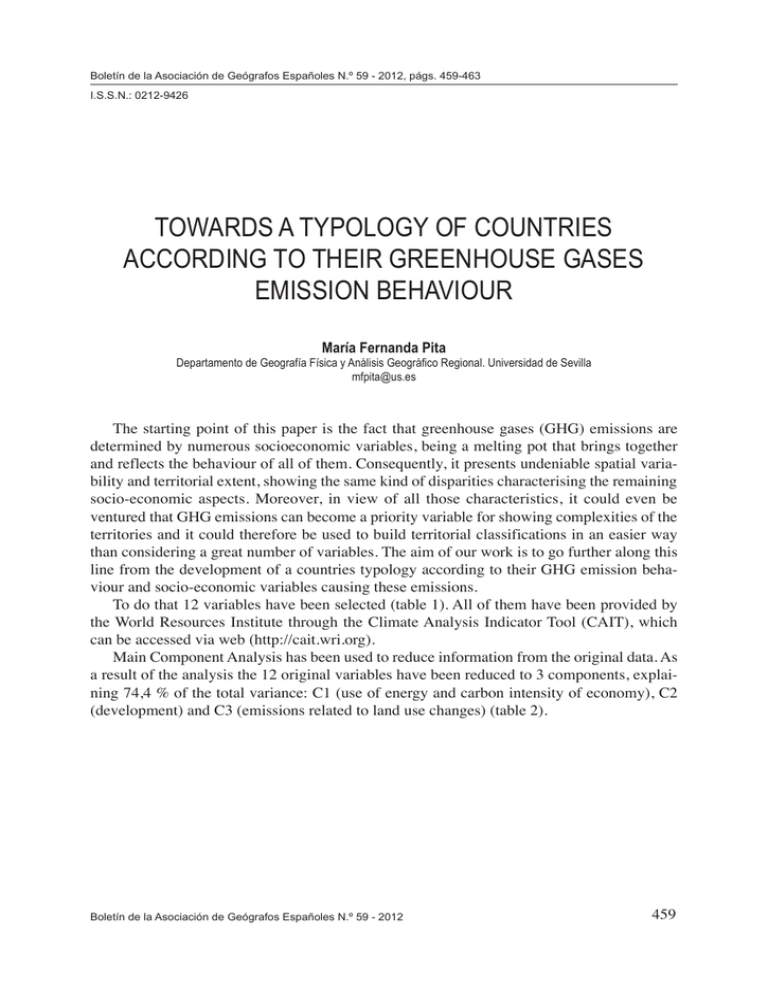
Towards ade typology of countries according theirpágs. greenhouse gases emission behaviour Boletín de la Asociación Geógrafos Españoles N.º 59 -to 2012, 459-463 I.S.S.N.: 0212-9426 TOWARDS A TYPOLOGY OF COUNTRIES ACCORDING TO THEIR GREENHOUSE GASES EMISSION BEHAVIOUR María Fernanda Pita Departamento de Geografía Física y Análisis Geográfico Regional. Universidad de Sevilla [email protected] The starting point of this paper is the fact that greenhouse gases (GHG) emissions are determined by numerous socioeconomic variables, being a melting pot that brings together and reflects the behaviour of all of them. Consequently, it presents undeniable spatial variability and territorial extent, showing the same kind of disparities characterising the remaining socio-economic aspects. Moreover, in view of all those characteristics, it could even be ventured that GHG emissions can become a priority variable for showing complexities of the territories and it could therefore be used to build territorial classifications in an easier way than considering a great number of variables. The aim of our work is to go further along this line from the development of a countries typology according to their GHG emission behaviour and socio-economic variables causing these emissions. To do that 12 variables have been selected (table 1). All of them have been provided by the World Resources Institute through the Climate Analysis Indicator Tool (CAIT), which can be accessed via web (http://cait.wri.org). Main Component Analysis has been used to reduce information from the original data. As a result of the analysis the 12 original variables have been reduced to 3 components, explaining 74,4 % of the total variance: C1 (use of energy and carbon intensity of economy), C2 (development) and C3 (emissions related to land use changes) (table 2). Boletín de la Asociación de Geógrafos Españoles N.º 59 - 2012 459 María Fernanda Pita Table 1 USED VARIABLES Indicator Nº Variables Units Year Emissions 1 2 3 4 5 Total GHG emissions per capita Energy CO2 emissions per capita Industrial processes CO2 emissions per capita Agriculture CH4 emissions per capita Land-use change CO2 emissions per capita tCO2e tCO2e tCO2e tCO2e tCO2e 6 Total CO2 cumulative emissions per capita tCO2e 2000 2004 2004 2000 2000 18502004 18502000 2004 8 Land-use change cumulative CO2 emissions per capita Energy use per capita 9 Carbon intensity of economy 10 11 Carbon intensity of energy Income per capita (GDP PPP) 12 Governance index 7 Socioeconomic tCO2e toe tCO2 / Mill. Intl $ tCO2 / toe Intl $ Index (0-100) Nº of countries 185 131 184 185 149 185 149 129 2004 183 2004 2004 129 183 2006 185 Table 2 CORRELATION COEFFICIENT BETWEEN ANALYZED VARIABLES AND SELECTED COMPONENTS Components Variables GDP per capita Energy use per capita Governance index Total GHG emissions per capita Energy CO2 emissions per capita Industrial processes CO2 emissions per capita Agriculture CH4 emissions per capita Land use change CO2 emissions per capita Total CO2 cumulative emissions per capita Land use change CO2 cumulative emissions per capita Carbon intensity of economy Carbon intensity of energy 460 C1 (41,4%) 0,423 0,759 0,124 0,423 0,813 0,644 0,028 -0,149 0,632 -0,136 0,757 0,685 C2 (21%) 0,847 0,497 0,894 0,251 0,447 0,383 0,354 -0,110 0,573 -0,080 -0,403 0,088 C3 (12%) 0,017 0,064 -0,004 0,833 0,055 -0,017 -0,017 0,970 -0,001 0,972 0,028 -0,107 Boletín de la Asociación de Geógrafos Españoles N.º 59 - 2012 Towards a typology of countries according to their greenhouse gases emission behaviour The application of Cluster Analysis to the three selected components leads to a typology consisting of 12 types of countries that can be grouped into 5 main blocs. The average component scores of the 12 types can be seen in figure 1, and the countries belonging to each type in table 3. The first bloc includes those countries with a clear dominance of the first component, which is positive in all cases and holds the highest value of them all, as a result of a high carbon intensity and/or a high energy consumption. Subsequently, nuances in the values of this component, together with variations in development levels, will establish different types within this bloc. The second bloc of countries is associated with wealth and high level of development, so the dominance of the second component is a common rule in all of Figure 1 AVERAGE COMPONENT SCORES OF THE 12 COUNTRY TYPES Boletín de la Asociación de Geógrafos Españoles N.º 59 - 2012 461 María Fernanda Pita Table 3 TYPOLOGY OF COUNTRIES ACCORDING TO THEIR EMISSION BEHAVIOUR Type 1.1 Country Libya Serbia Kazakhstan Turkmenistan Type 2.2 Uzbekistan 1.2 North Korea Iraq Trinidad and Tobago Brunei France United Arab Emirates Norway Ireland 2.3 Angola Syria Azerbaijan Jamaica Lebanon Nauru Venezuela Russia Equatorial Guinea 462 Cote d’Ivoire Nigeria Zimbabwe Pakistan Bangladesh Haiti Togo Sudan Sierra Leone Lithuania Vanuatu Eritrea Grenada Guinea Kiribati Cook Islands Cape Verde Samoa Mauritius Saint Lucia Spain Saint Vincent and Grenadines Taiwan 3.1 Barbados Guatemala Seychelles Latvia Italy Jordan China Ukraine Bahamas Cameroon Chile Slovenia Macedonia Tonga Saint Kitts and Nevis Portugal Yemen Iran Lesotho Hungary Congo Byelorussia Ghana Argentina Cuba Paraguay Fiji Malta Moldova Country Myanmar Dem. Republic Congo Madagascar Bhutan New Zealand 5.2 Benin Cambodia 4.2 Type Nepal Laos Switzerland Ireland Country Sao Tome and Principe Tanzania Sweden Bahrain Kyrgyzstan 4.1 Belgium Singapore Kuwait Qatar Tajikistan Type Austria Saudi Arabia 1.3 Country Germany Netherlands Denmark United Kingdom Dominica Uruguay Belize Guyana Zambia Papua New Guinea Brazil 5.1 Botswana Honduras Vietnam Albania Malaysia Dominican Republic Nicaragua India Bolivia Armenia Panama Bosnia and Herzegovina Indonesia Central African Rep. Guinea-Bissau Chad Burundi Palau Surinam Colombia Namibia Maldives Sri Lanka Mauritania Kenya Niue El Salvador Filipinas Georgia Senegal Morocco Boletín de la Asociación de Geógrafos Españoles N.º 59 - 2012 Towards a typology of countries according to their greenhouse gases emission behaviour Type 1.4 Country Estonia Oman Czech Republic Cyprus Israel Estonia South Korea Greece 2.1 2.2 Poland Luxembourg Canada Australia United States Japan Finland Type 4.1 Country Antigua Type Costa Rica Country Mongolia Uganda Gabon Rwanda Bulgaria Mozambique South Africa Gambia Croatia Burkina Faso Tunis Swaziland Mexico Djibouti Romania Salomon Islands Niger Type Ecuador Mali Comoros Country Algeria Malawi Ethiopia Egypt Turkey 5.2 Thailand Liberia Peru them. A typology is established here according to the C2 value and the energy consumption, which can be very variable from one country to another. The third bloc consists of all those countries where the third component, ie, the one associated with land use change, is the most significant; the two remaining components being slightly negative. The fourth bloc is composed of countries with a low energetic component, as results of a reduced energy use and, above all, low carbon and energy intensities. They also present a variable level of development, but with values next to zero, and slightly negative C3 values. The fifth and last bloc integrates most of underdeveloped countries. Energetic and, especially, development components present low values in these countries, and they do not even produce strong emissions from land use changes. The results confirm the territorial importance currently acquired by the variables associated with GHG emissions, configuring a typology of countries which basis goes beyond the mere reality of these emissions. Boletín de la Asociación de Geógrafos Españoles N.º 59 - 2012 463
