PRÁCTICA 4: EL MODELO LINEAL DE PROBABILIDAD
Anuncio
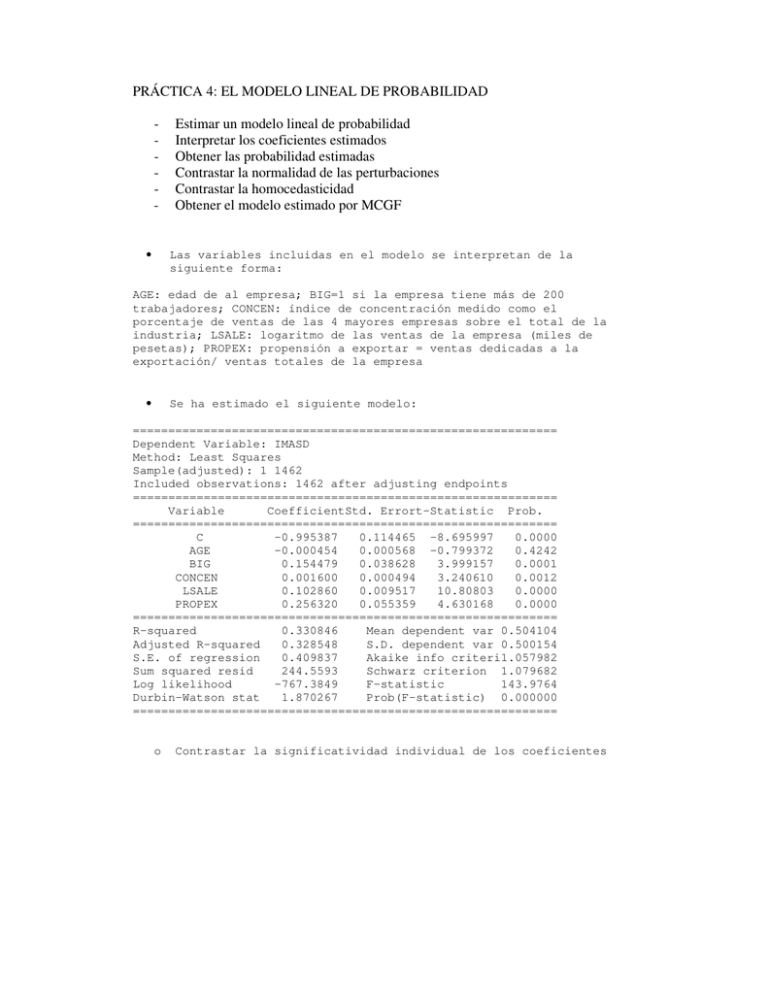
PRÁCTICA 4: EL MODELO LINEAL DE PROBABILIDAD • Estimar un modelo lineal de probabilidad Interpretar los coeficientes estimados Obtener las probabilidad estimadas Contrastar la normalidad de las perturbaciones Contrastar la homocedasticidad Obtener el modelo estimado por MCGF Las variables incluidas en el modelo se interpretan de la siguiente forma: AGE: edad de al empresa; BIG=1 si la empresa tiene más de 200 trabajadores; CONCEN: índice de concentración medido como el porcentaje de ventas de las 4 mayores empresas sobre el total de la industria; LSALE: logaritmo de las ventas de la empresa (miles de pesetas); PROPEX: propensión a exportar = ventas dedicadas a la exportación/ ventas totales de la empresa • Se ha estimado el siguiente modelo: ============================================================ Dependent Variable: IMASD Method: Least Squares Sample(adjusted): 1 1462 Included observations: 1462 after adjusting endpoints ============================================================ Variable CoefficientStd. Errort-Statistic Prob. ============================================================ C -0.995387 0.114465 -8.695997 0.0000 AGE -0.000454 0.000568 -0.799372 0.4242 BIG 0.154479 0.038628 3.999157 0.0001 CONCEN 0.001600 0.000494 3.240610 0.0012 LSALE 0.102860 0.009517 10.80803 0.0000 PROPEX 0.256320 0.055359 4.630168 0.0000 ============================================================ R-squared 0.330846 Mean dependent var 0.504104 Adjusted R-squared 0.328548 S.D. dependent var 0.500154 S.E. of regression 0.409837 Akaike info criteri1.057982 Sum squared resid 244.5593 Schwarz criterion 1.079682 Log likelihood -767.3849 F-statistic 143.9764 Durbin-Watson stat 1.870267 Prob(F-statistic) 0.000000 ============================================================ o Contrastar la significatividad individual de los coeficientes • Modelo estimado eliminando AGE: ============================================================ Dependent Variable: IMASD Method: Least Squares Sample(adjusted): 1 1462 Included observations: 1462 after adjusting endpoints ============================================================ Variable CoefficientStd. Errort-Statistic Prob. ============================================================ C -0.982770 0.113357 -8.669653 0.0000 BIG 0.150866 0.038358 3.933121 0.0001 CONCEN 0.001585 0.000493 3.213944 0.0013 LSALE 0.101349 0.009326 10.86701 0.0000 PROPEX 0.257928 0.055315 4.662875 0.0000 ============================================================ R-squared 0.330552 Mean dependent var 0.504104 Adjusted R-squared 0.328715 S.D. dependent var 0.500154 S.E. of regression 0.409786 Akaike info criteri1.057053 Sum squared resid 244.6666 Schwarz criterion 1.075136 Log likelihood -767.7056 F-statistic 179.8554 Durbin-Watson stat 1.870418 Prob(F-statistic) 0.000000 o o o Interpretación de los coeficientes estimados en términos de impactos sobre la probabilidad Distinguir entre variables ficticias y variables continuas Caso especial: LSALE • Contrastando la normalidad de las perturbaciones 300 Series: Residuals Sample 1 1462 Observations 1462 250 200 150 100 50 0 -1.0 o o o -0.5 0.0 0.5 Mean Median Maximum Minimum Std. Dev. Skewness Kurtosis 3.53E-17 -0.075853 1.062849 -1.025349 0.409225 0.200096 2.411809 Jarque-Bera Probability 30.83128 0.000000 1.0 ¿Cuál es el resultado del contraste? ¿Cuál es la expresión del estadístico utilizado? Establecer un argumento teórico para este resultado empírico • Contrastando la homocedasticidad del modelo ============================================================ White Heteroskedasticity Test: ============================================================ F-statistic 10.70360 Probability 0.000000 Obs*R-squared 128.1751 Probability 0.000000 ============================================================ Test Equation: Dependent Variable: RESID^2 Method: Least Squares Sample: 1 1462 Included observations: 1462 ============================================================ Variable CoefficientStd. Errort-Statistic Prob. ============================================================ C -0.976921 0.377896 -2.585155 0.0098 BIG 0.180514 0.266242 0.678008 0.4979 BIG*CONCEN 0.000985 0.000810 1.216427 0.2240 BIG*LSALE -0.020046 0.018630 -1.075979 0.2821 BIG*PROPEX -0.142570 0.082776 -1.722345 0.0852 CONCEN 0.005239 0.002464 2.126651 0.0336 CONCEN^2 6.20E-06 8.21E-06 0.756056 0.4497 CONCEN*LSALE -0.000416 0.000195 -2.132397 0.0331 CONCEN*PROPEX -0.000994 0.001205 -0.824843 0.4096 LSALE 0.142734 0.060659 2.353034 0.0188 LSALE^2 -0.003943 0.002458 -1.604423 0.1088 LSALE*PROPEX -0.037606 0.025670 -1.464975 0.1431 PROPEX 0.506092 0.337476 1.499637 0.1339 PROPEX^2 0.110787 0.074115 1.494800 0.1352 ============================================================ R-squared 0.087671 Mean dependent var 0.167351 Adjusted R-squared 0.079480 S.D. dependent var 0.198913 S.E. of regression 0.190845 Akaike info criter-0.465182 Sum squared resid 52.73870 Schwarz criterion -0.414549 Log likelihood 354.0482 F-statistic 10.70360 Durbin-Watson stat 1.970044 Prob(F-statistic) 0.000000 o o o o ¿En qué consiste el contrate de White? ¿Cuál es la importancia de la regresión auxiliar? ¿Cuál es el resultado del contraste? Establecer una correspondencia teórica con esta evidencia empírica • obs 1 2 3 4 5 6 7 8 9 10 11 12 13 14 15 16 17 18 19 20 21 22 23 24 25 26 27 28 29 30 31 32 33 34 35 36 37 38 39 40 o o o Obtención de las probabilidades estimadas: BIG 1 0 1 0 0 0 0 0 0 1 0 0 0 0 0 0 0 0 0 0 0 0 0 1 0 0 0 0 0 0 0 0 0 0 0 0 0 0 1 0 CONCEN 69.125 9 85.5597763062 0 66.6666641235 61.1594085693 25.2706356049 0 28.9246311188 34.4378929138 87 23.6513385773 39 17.5924224854 95 23.6513385773 45.2491416931 45.2491416931 24.8095569611 18.6023426056 50.6266708374 10.7479410172 45.2491416931 40 43.3333320618 40.5515556335 68.4370040894 27.0983276367 13 45.2491416931 45.2491416931 20.9035015106 24.8095569611 50.237121582 34.5894889832 43.5 0 40 42.9227180481 61.1594085693 LSALE 15.7293205261 12.9478912354 15.2443008423 10.6705732346 11.9781970978 12.2158412933 11.7060689926 12.2755308151 14.1978712082 16.3722400665 16.0847911835 12.8762788773 12.3271255493 10.3692235947 12.4627332687 10.928311348 10.7799081802 10.5434141159 10.3728046417 9.83832454681 15.5133800507 13.4819688797 12.5820360184 15.1771450043 11.9724903107 12.6702003479 13.6186189651 11.3603973389 13.8744516373 10.861000061 11.29600811 10.8615627289 13.0774765015 12.4121189117 12.9706430435 13.7544031143 10.9779033661 13.7275543213 16.6418800354 12.5343418121 PROPEX 0.000612212053 0.031027723103 0.29033768177 0 0 0 0.139973759651 0 0 0.352031081915 0.094020351767 0 0 0 0 0 0 0 0 0.383559465408 0.229714691639 0 0 0.061375197023 0 0 0 0 0 0 0.076321750879 0 0.298074185848 0 0.002124672289 0 0 0 0.346682578325 0 IMASD 1 0 1 0 0 0 0 1 1 1 1 0 0 0 1 1 0 0 0 0 0 1 0 1 0 0 0 0 0 0 0 0 0 0 0 1 0 0 1 0 Interpretación de IMASDF como una probabilidad estimada Detectar aciertos y errores en la predicción Detectar probabilidades estimadas absurdas IMASDF 0.870044850458 0.357420218479 0.938402878059 0.10173327704 0.34151651611 0.358512121699 0.283638667047 0.266365287911 0.50945840668 0.988005699264 0.812378528827 0.36190821081 0.331789512185 0.087534985954 0.423974729658 0.165623992041 0.18309300197 0.160128409709 0.109883652411 0.14238429649 0.727024303605 0.408105860369 0.368459639009 0.782233519796 0.302243529798 0.369560065459 0.497655554221 0.215128509095 0.439374930892 0.187350632277 0.252112005198 0.148010634915 0.45314521885 0.339451025198 0.383304083477 0.485343740075 0.133345214738 0.471085006154 1.02522021941 0.386282136097 • Utilización de MCG factibles ============================================================ Dependent Variable: IMASD/DW Method: Least Squares Date: 03/13/03 Time: 13:19 Sample(adjusted): 1 1462 Included observations: 1462 after adjusting endpoints ============================================================ Variable CoefficientStd. Errort-Statistic Prob. ============================================================ 1/DW -0.897951 0.133264 -6.738155 0.0000 BIG/DW 0.220810 0.106830 2.066925 0.0389 CONCEN/DW 0.002748 0.000531 5.170350 0.0000 LSALE/DW 0.091214 0.013550 6.731511 0.0000 PROPEX/DW -0.276574 0.045551 -6.071799 0.0000 ============================================================ R-squared 0.912718 Mean dependent var 3.822576 Adjusted R-squared 0.912478 S.D. dependent var 25.90417 S.E. of regression 7.663504 Akaike info criteri6.914230 Sum squared resid 85568.58 Schwarz criterion 6.932313 Log likelihood -5049.302 Durbin-Watson stat 1.984700 o o o o o Interpretación del modelo transformado ¿Qué representa DW? ¿Cómo se obtiene DW? ¿Qué problema plantea DW? El concepto de estimador eficiente
