Discussing the inter-sectoral linkages in Ecuador, with a focus on
Anuncio
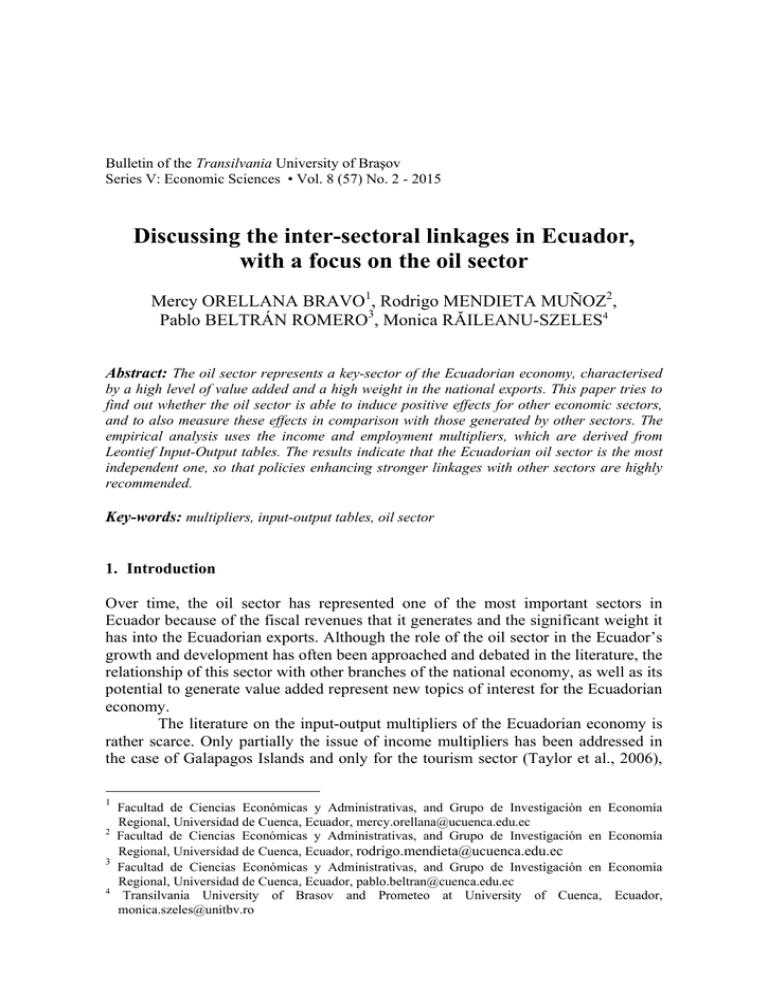
Bulletin of the Transilvania University of Braşov Series V: Economic Sciences • Vol. 8 (57) No. 2 - 2015 Discussing the inter-sectoral linkages in Ecuador, with a focus on the oil sector Mercy ORELLANA BRAVO1, Rodrigo MENDIETA MUÑOZ2, Pablo BELTRÁN ROMERO3, Monica RĂILEANU-SZELES4 Abstract: The oil sector represents a key-sector of the Ecuadorian economy, characterised by a high level of value added and a high weight in the national exports. This paper tries to find out whether the oil sector is able to induce positive effects for other economic sectors, and to also measure these effects in comparison with those generated by other sectors. The empirical analysis uses the income and employment multipliers, which are derived from Leontief Input-Output tables. The results indicate that the Ecuadorian oil sector is the most independent one, so that policies enhancing stronger linkages with other sectors are highly recommended. Key-words: multipliers, input-output tables, oil sector 1. Introduction Over time, the oil sector has represented one of the most important sectors in Ecuador because of the fiscal revenues that it generates and the significant weight it has into the Ecuadorian exports. Although the role of the oil sector in the Ecuador’s growth and development has often been approached and debated in the literature, the relationship of this sector with other branches of the national economy, as well as its potential to generate value added represent new topics of interest for the Ecuadorian economy. The literature on the input-output multipliers of the Ecuadorian economy is rather scarce. Only partially the issue of income multipliers has been addressed in the case of Galapagos Islands and only for the tourism sector (Taylor et al., 2006), 1 2 3 4 Facultad de Ciencias Económicas y Administrativas, and Grupo de Investigación en Regional, Universidad de Cuenca, Ecuador, [email protected] Facultad de Ciencias Económicas y Administrativas, and Grupo de Investigación en Regional, Universidad de Cuenca, Ecuador, [email protected] Facultad de Ciencias Económicas y Administrativas, and Grupo de Investigación en Regional, Universidad de Cuenca, Ecuador, [email protected] Transilvania University of Brasov and Prometeo at University of Cuenca, [email protected] Economía Economía Economía Ecuador, 408 M. ORELLANA BRAVO, R. MENDIETA MUÑOZ, P. BELTRAN ROMERO et al. which is the engine of economic growth in that region. A pioneering attempt to build a fully-specified interregional input-output matrix for Ecuador under the conditions of limited information belongs to Haddad et al. (2011). The aim of this paper is to analyze the relationship of the oil sector with other economic sectors by using the income and employment multipliers, and also to formulate policy recommendations. Considering that the determination and analysis of multipliers for Ecuador has not been approached by now, our paper could bring new and useful empirical insights to the literature. The paper is structured as follows: after the introduction, the first section introduces the concepts, the second section presents the methodology, the third section is the empirical analysis, and the last section concludes and formulates policy recommendations. 2. Theoretical insights The input-output multipliers represent a popular concept in macroeconomics, indicating how much an endogenous factor change in response to a change in an exogenous factor. It is often referred to as a proportionality factor. Multipliers are generally used to analyze the changes occurring in a certain country, region, sector or industry. The rationale behind the concept of multipliers is the following: the increase in the final demand of a certain product will also determine the increase in the output of that product, therefore generating a direct effect. This increase in the output of that product will further stimulate the demand of their suppliers, therefore inducing an indirect effect. The input-output multipliers are built based on Leontief input-output tables. The input-output tables represent a system of linear equations used to describe a simple view of an economy, with the final aim to predict the proper level of production for different types of goods or services. There is a broad strand of literature examining different types of multipliers, such as the employment and income multipliers (e.g. Craig, 1980; West and Jensen, 1980; Liu et al., 1984), most of them being calculated using standard input-output models and standard linear equations. Sectoral multipliers (employment or income) are designed to measure the impact of an increase in final demand on income or employment (McGilvrey, 1977). They were intensively studied in the ’80-’90, in relation with “linkages measures”, as to identify the key-sectors in a regional or national industrial development program. Although the study of sectoral multipliers has deep roots in the industrial economics, it is also important in our days, especially for the developing countries, which are in train to embark on the road of economic development. The employment and income multipliers are particularly discussed in this paper, so in the theoretical section we define only these two multipliers. The Discussing the inter-sectoral linkages in Ecuador, with a focus on the oil sector 409 employment multiplier is the ratio of direct plus indirect employment changes to the direct employment change. The income multipliers are defined in the same way, as the ratio of direct plus indirect income changes to the direct income change, therefore showing the change in income occurring throughout the economy as a result of a change in final demand. When interpreting the effects of multipliers, analyses use to report type I and type II multipliers. Type I multipliers sum together direct and indirect effects, while type II multipliers also include induced effects. 3. Methodology The analysis of the impact that the Ecuadorian oil sector brings into the national economy should start from the construction of the Input-Output matrix. In our study, the matrix incorporates a number of 16 productive sectors, the final demand and the payment for two production factors, namely labor and capital. The data are provided by the Ecuador’s Central Bank. Given that the definition and formulas of multipliers follow the same pattern, for exemplification, only the employment multiplier is discussed below. In this particular case, the indicator ME measures the direct and indirect effects of the type I employment multiplier, while the indicator M’E measures the direct, indirect and induced effects of the type II employment multiplier. ME = ∑ n ei bij i =1 ej n +1 ei bij' i =1 ej M E' = ∑ (1) (2) where, - bij represents the Leontief coefficient indicating the direct and indirect (interindustry) effects on the demand for the industry i output, as a consequence of changes in the industry j demand. - b'ij represents the Leontief coefficient indicating the direct, indirect (interindustry) and induced effects (by household expenditure) on the demand for the industry i output, as a consequence of changes in the industry j demand. - ei/ ej is the employment per $1 of total inputs or output/ sales. - i is the supplying industry - j is the receiving industry 410 M. ORELLANA BRAVO, R. MENDIETA MUÑOZ, P. BELTRAN ROMERO et al. 4. The role of the oil sector in the Ecuadorian economy Since 1970 the oil extraction and export have played a crucial role in the Ecuadorian economy. In 1975 the revenues from the oil sector accounted for 42.51% of the total tax revenues, 62.01% of the total exports and 13.51% of the national value added, while in 2014 the percentages were 18.47%, 51.70% and 10.41%, respectively. These figures indicate that even though in present the contribution of the oil sector to the total governmental revenues is low, its proportion into the total exports and value added remains significant. This reflects the importance of the oil sector into the Ecuadorian economy in the past and in present as well. The importance of the oil sector explains its strong connection with the national economy. Each recession experienced by Ecuador in the last four decades has also been accompanied by large fluctuations in the oil production and price. For exemplification we explain the economic recession of 1999. As shown in Fig.1, the sharp decrease of GDP in 1999 signified the most serious economic recession since 1970 onwards. This moment has been preceded by the disastrous effects of El Nino and the drop of the oil price in 1998. Fig.1. The dynamic of economic growth rate in Ecuador, from 1970 to 2014 Note. Ecuador’s Central Bank data As to avoid the bankruptcy of a number of private banks, the Central Bank launched that time an expansionary monetary policy, allowing for an inflation rate of 60% and a devaluation of 300%. That time the national production experienced a contraction of 7% (Mendieta Muñoz 2015). Discussing the inter-sectoral linkages in Ecuador, with a focus on the oil sector 411 5. Empirical analysis As shown in the theoretical section, the employment and income multipliers give insights to the effect of any change in employment and associated income in a particular sector on the total employment and income. The determining of income and employment multipliers is subsequent to the construction of the Input-Output matrix5. Two major characteristics, specific to the small economy status, arise when analyzing the Ecuadorian Input-Output matrix. The first characteristic is the reliance on only few economic sectors, i.e. oil and refining, constructions and manufacturing. The second one is the high proportion of exports into the GDP, which accounted for 25% in 2013. As shown in Tab.1, every dollar invested in the manufacturing sector generates an increase in the total income of all employees working in different sectors of $0.31 under an open economy and $0.53 under a closed economy. However, when considering the sectors with the highest proportion of human capital, such as it is the education, the income multipliers are higher - $0.69 for an open economy and $1.20 for a closed economy. The explanation is that most of the value added generated by this type of sectors is paid in wages. 1. Agriculture, livestock and forestry 2. Fishery 3. Oil and refining 4. Mining and quarrying 5. Manufacturing 6. Electricity and water 7. Construction 8. Trade 9. Hotels and restaurants 10. Transport, information and communications 11. Financial activities 12. Professional and real estate activities 13. Public administration 14. Education 15. Health 16. Other services Open economy 0,27 0,27 0,12 0,25 0,31 0,35 0,27 0,50 0,30 0,29 0,38 0,29 0,64 0,69 0,54 0,57 Close economy 0,46 0,48 0,21 0,43 0,53 0,60 0,47 0,87 0,53 0,50 0,67 0,50 1,11 1,20 0,94 0,98 Table 1. Income multipliers, Ecuador, 2013 Note. Authors’ elaboration 5 Even though the calculation of income and employment multipliers also involved the construction of the Leontief Input-Output matrix, this is not presented here. 412 M. ORELLANA BRAVO, R. MENDIETA MUÑOZ, P. BELTRAN ROMERO et al. One of the most interesting sectors to analyze is the oil sector, where one invested dollar generates an increase in the workers’ cumulated income of only $0.12 under an open economy ($0.21 under a close economy). These increases could be further disaggregated as follows: $0.055 ($0.06)6 for workers in this sector, $0.03 ($0.04) for workers in the retail, $ 0.01 ($0.03) for workers in the professional and real estate activities, while for the rest of sectors the increase is below $0.01 ($0.02). The impact of a $1 investment into the oil sector on wages depends upon how much added value is spent inside Ecuador (see Fig.2). Moreover, the investment into a labor-intensive sector generates a different impact in comparison with a capital-intensive sector. Given that the oil sector is a capital-intensive one (70%), the impact on the future series of wages is found to be rather low. Fig. 2. Disaggregated income multiplier, 2013 Note. Disaggregation of $1 investment in the oil sector Another important indicator is the employment multiplier, which gives insights to the process of job creation. According to Tab. 2, an investment of $12.000 under an open economy or 8.000$ under a close economy is able to facilitate the creation of a new job in the manufacturing sector. For comparison, the creation of a new job in 6 In brackets are indicated the values for a close economy. Discussing the inter-sectoral linkages in Ecuador, with a focus on the oil sector 413 the oil sector requests an investment of $50.000 under an open economy, and $34.000 under a close economy. 1. Agriculture, livestock and forestry 2. Fishery 3. Oil and refining 4. Mining and quarrying 5. Manufacturing 6. Electricity and water 7. Construction 8. Trade 9. Hotels and restaurants 10. Transport, information and communications 11. Financial activities 12. Professional and real estate activities 13. Public administration 14. Education 15. Health 16. Other services Open economy 0,16 0,08 0,02 0,08 0,08 0,05 0,07 0,12 0,13 0,07 0,03 0,04 0,04 0,07 0,06 0,11 Close economy 0,20 0,13 0,03 0,12 0,13 0,10 0,12 0,21 0,18 0,12 0,09 0,09 0,15 0,18 0,15 0,20 * For each $ thousand investment Table 2. Employment multipliers, Ecuador, 2013 Note. Authors’ elaboration In both the open and close economies, the sector facilitating the most jobs creation is “Hotels and Restaurants”. To stimulate the process of job creation in this sector, specific public policies should be addressed. In conclusion, when discussing the income and employment multipliers for the oil sector we find that their values are the lowest in comparison with the other sectors. This clearly suggests that the Ecuadorian oil sector, which brings the highest value added in the national economy, is an independent sector. This means that it has low backward and forward relations with the other sectors. The transfer of performances of this top-sector in terms of employment and income toward the other economic sectors is therefore weak. 6. Conclusions This paper has shown that, in the case of Ecuador, the sectors generating the higher value added (e.g. the oil sector) are not necessary those also having the highest 414 M. ORELLANA BRAVO, R. MENDIETA MUÑOZ, P. BELTRAN ROMERO et al. income and employment multipliers. The main focus here was on the oil sector which generates 13% of the national value added and has a multiplier of only 1.45 under an open economy and 2.07 under a close economy. The results of our empirical analysis suggest that the oil sector is highly independent, although its level of production as well as the generated value-added is the highest. With regard to employment and income, the multiplier effect of the oil sector in the national economy is definitely low. Our empirical results are suggestive for the policy makers in the sense that specific public policies should stimulate the development of stronger linkages between the oil sector and the rest of economic sectors, as well as a large spreading of the oil sector performance into the national economy. 7. References Davis, H. Craig. 1980. “Income and Employment Multipliers for a Small B.C. Coastal Region." Canadian Journal of Regional Science 3: 227-35. Haddad, E.A., J.M. Samaniego, A.A. Porsse, D.A. Jimenez, W.S. Moreno, J. de Liu, T. Var, and A. Timur. 1984. “Tourism-income multipliers for Turkey.” Tourism management 5(4): 280-287. McGilvray, L. 1977. ”Linkages, key sectors and development strategy.” In Structure, system and economic policy, ed. by W. Leontief, 49-57. Cambridge University Press. Mendieta Muñoz, Rodrigo. 2015. Remesas y disparidades económicas territoriales. El caso ecuatoriano. Cuenca, Ecuador: México, D.F: Miguel Ángel Porrúa. Souza, L.G. 2011. “Interregional Input-Ouptut System for Ecuador, 2007: Methodology and Results.” Working Paper Series Department of EconomicsFEA/ USP 2011-08. Taylor, J.E., J. Hardner, and M. Stewart. 2006. “Ecotourism and Economic Growth in the Galapagos: An Island Economy-wide Analysis.” Working Paper Giannini Foundation of Agricultural Economics 06-001. West, G.R., and R.C. Jensen. 1980. “Some reflections on input-output multipliers.” The annals of regional science 14(2): 77-89.
