The Beer Game-SCM - U
Anuncio

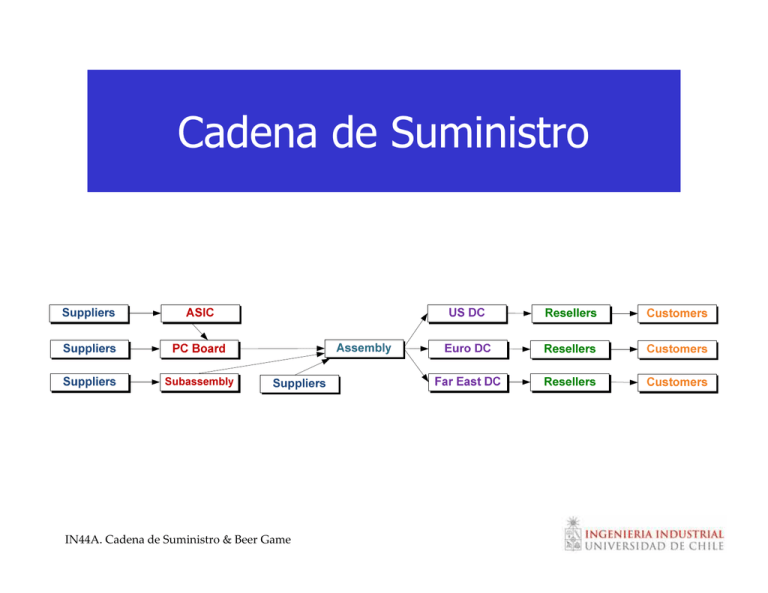
Cadena de Suministro IN44A. Cadena de Suministro & Beer Game Red de Suministro IN44A. Cadena de Suministro & Beer Game Global Sourcing IN44A. Cadena de Suministro & Beer Game Balancing Cost and Service Satisfaction with results achieved through low-cost country sourcing program 86% 40% 1% Total Cost 9% Quality 33% 16% 14% 14% Delivery Reliability Dissatisfaction 42% Lead Times IN44A. Cadena de Suministro & Beer Game Satisfaction 48% Product Innovation Global Logistics Cameroon 5787 Zambia 4616 Algeria 2248 Kazakhstan 2029 1800 China 1631 Korea United States 1428 India Total Cost for a Typical Import Transaction 1409 Brazil 1335 South Africa 1242 Malaysia 841 Ireland 821 700 Spain Sweden 550 Norway 506 Thailand 501 0 1000 Source: World Bank Global Logistics Indicators Survey 2000 IN44A. Cadena de Suministro & Beer Game 3000 4000 US $ 5000 6000 7000 80 Global Logistics Average Time for a Typical Import Transaction By region 60 69 58 Days 40 53 49 49 46 48 41 33 36 37 LAC MENA 44 20 28 0 14 OECD EAP SAS ECA AFR Source: World Bank Global Logistics Indicators Survey IN44A. Cadena de Suministro & Beer Game Global Logistics Source: World Bank Global Logistics Indicators Survey IN44A. Cadena de Suministro & Beer Game Global Logistics Congo, Dem.Rep. 42 Azerbaijan 40 39 Nigeria Mongolia Lao PDR 21 17 Bangladesh 15 Senegal 8 7 7 Colombia China Venezuela United States 6 5 5 5 Italy Ireland Korea 3 3 3 3 Indonesia France Finland Singapore 0 Number of Signatures for Typical Export Transaction 2 Source: World Bank Global Logistics Indicators Survey 10 IN44A. Cadena de Suministro & Beer Game 20 30 40 SCM Logistics Costs Components of 1999 Logistics Costs Total US Logistics Costs (US$ 921 Billion) Stock Keeping • 18% - 35% per Year 82 % Interests + Cost K 14 % Obsolescence 3,3 % Holding 0,5 % Taxes 0,25% Insurance Source: Herbert W. Davis; “Phisical Distribution Costs: Performance In Selected Industries, 1988, CLM Storage Inventory Carrying Costs 28% Warehousing 8% Administration Costs 4% Other Costs 1% Forwarders Freight 1% Oil Pipelines 1% Air Freight 3% Water Freight 2% Ground Transportation Railroads Freight 4% Motor Carriers 48% S o urc e : A dpated fro m Ro salyn Wilso n and Ro bert V. Delaney, 11th A nnual State o f Lo gistics Repo rt, remarks made to the Natio nal P ress Club, Washingto n,. D.C. (June 5, 2000) Transportation Cost + Inventory Costs = 84% IN44A. Cadena de Suministro & Beer Game Cadena de Suministro Beer Game IN44A. Cadena de Suministro & Beer Game Cadena de Suministro Fábrica Distribuidor Mayorista Retailer Consumidor Final IN44A. Cadena de Suministro & Beer Game Beer Game Producción Demanda Retailer orders orders orders Mayorista Distribuidor Fábrica 1. Se sintió de tanto en tanto “bajo el efecto” de fuerzas fuera de su control? (i.e., desprotegido frente a ordenes de demanda muy altas o teniendo mucho inventario) 2. Se encontró “culpando” a la persona sentada a su izquierda o derecha por sus problemas? IN44A. Cadena de Suministro & Beer Game Variabilidad de las órdenes Aumenta “Aguas Arriba” en la Cadena 20 15 10 5 0 Retailer’s Order to Manufacture Order Quantity Order Quantity Consumer Sales Time 20 15 10 5 0 20 15 10 5 0 Manufacturer’s Orders to Supplier Order Quantity Order Quantity Wholesaler’s Orders to Manufacture Time IN44A. Cadena de Suministro & Beer Game Time 20 15 10 5 0 Time La información se distorsiona por distintos motivos al avanzar hacia atrás en la cadena de suministro. Esto genera muchísimos costos (desperdicios) de exceso de inventario, quiebres de stock, capacidad ociosa, mayor riesgo operacional. Este fenómeno se conoce como EL EFECTO LATIGO. IN44A. Cadena de Suministro & Beer Game Ejemplos Procter & Gamble (P&G) y Pañales Mercado razonablemente estable a nivel del consumidor final Alta variabilidad en los órdenes de P&G a sus proveedores (como 3M) P&G introdujo el termino “bullwhip effect” Hewlett Packard (HP) e Impresoras a Tinta Algo de variabilidad en ventas Mayor oscilación en ordenes a mayoristas Aun mayor oscilación en ordenes a la división de producción IN44A. Cadena de Suministro & Beer Game Algunas Soluciones al Efecto Látigo Pronósticos de Demanda & Visibilidad de Inventarios Sistemas de Información Integrados – EDI & B2B & RFID Reducir las Fluctuaciones de Precio - EDLP Nivelar Órdenes de Producción – Heijunka Reducir los Leadtimes de Producción y Transporte Vendor Managed Inventory – CRP Inventario Agregado – Echelon Inventory Alinear los Incentivos de las Partes Involucradas Diseño de Contratos – Penalidades por Devolución Reducir el “Shortage Gaming” Acortar la Cadena de Suministro Diseño de la Cadena Apropiada (e.g., eficiente vs. ágil) Operadores Logísticos – Consolidación Postponement – (e.g., Benetton) IN44A. Cadena de Suministro & Beer Game Diseño de la Cadena de Suministro Monitor Power Supply Keyboard Graphics Card BOX Other Components: CD-ROM, etc. SHIPPER Manuals Motherboard CPU IN44A. Cadena de Suministro & Beer Game Memory CUSTOMER Speakers ZARA: Fast Fashion Crecimiento de 20%/año desde los ‘90s. Margen neto del 10% INP una vez por semana, 12K nuevos productos/año 23-30 días entre diseño final y venta. IN44A. Cadena de Suministro & Beer Game How Fast is Zara’s Fast Fashion IN44A. Cadena de Suministro & Beer Game Dos Ejemplos de Fast-Fashion Zara (Spain) H&M (Sweden) The Gap (U.S.A.) Vertical Integration (2007) Fully integrated. Subcontracts cutting, sewing, and shipping Controls every link in the chain but does not own factories From design to store but outsources production No. of stores worldwide (2007) 1,361 1,522 >1,572 No. of Countries (2007) 68 28 21 Distribution of Stores - Main Locations (2007) 13% North Europe 60% South Europe 7% East Europe 8% Latin America 5% Asia Pacific 63.5% North Europe 19% South Europe 5% East Europe 12% North America 9% United Kingdom 79% North America 7% Japan Sourcing - Main Suppliers (2006) 34% Asia 50% Spain & Prox. 14% Rest of Europe >60% Asia <40% Europe 97% outside U.S.A. Assortment Composition (2006) 40% Basic 60% Fashion >70% Basic <30% Fashion 99% Basic Lead Times - Dual SC (2006) Efficient SC: 6 Months Responsive SC: 2-5 Weeks Efficient SC: 6 Months Responsive SC: 3-6 Weeks Efficient SC: 9 Months Refresh Fashion Items (2006) Twice a week Daily Occasionally Pricing (2002) Overall, higher than H&M (especially out of Spain) Lowest among Fast Fashion Comparable to Zara, if not higher Marketing Expenditure (2002) 0.3% of Revenues 3-4% of Revenues Comparable to H&M IN44A. Cadena de Suministro & Beer Game Source: Annual Reports and Public Press

