Dissolved oxygen
Anuncio
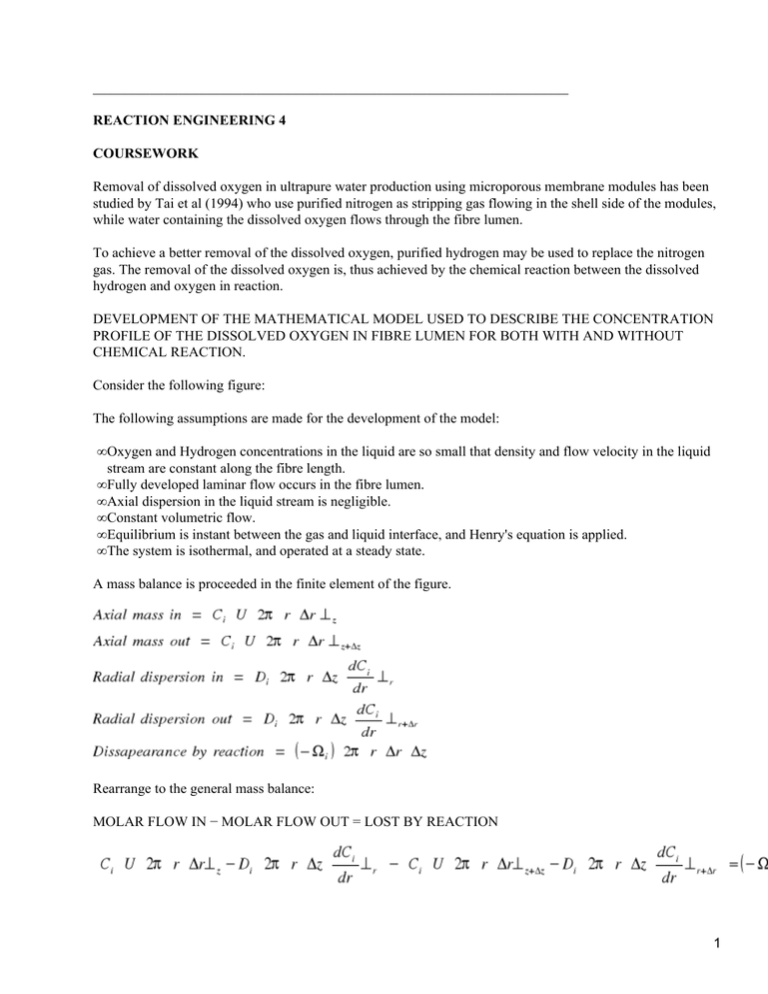
___________________________________________________________________ REACTION ENGINEERING 4 COURSEWORK Removal of dissolved oxygen in ultrapure water production using microporous membrane modules has been studied by Tai et al (1994) who use purified nitrogen as stripping gas flowing in the shell side of the modules, while water containing the dissolved oxygen flows through the fibre lumen. To achieve a better removal of the dissolved oxygen, purified hydrogen may be used to replace the nitrogen gas. The removal of the dissolved oxygen is, thus achieved by the chemical reaction between the dissolved hydrogen and oxygen in reaction. DEVELOPMENT OF THE MATHEMATICAL MODEL USED TO DESCRIBE THE CONCENTRATION PROFILE OF THE DISSOLVED OXYGEN IN FIBRE LUMEN FOR BOTH WITH AND WITHOUT CHEMICAL REACTION. Consider the following figure: The following assumptions are made for the development of the model: • Oxygen and Hydrogen concentrations in the liquid are so small that density and flow velocity in the liquid stream are constant along the fibre length. • Fully developed laminar flow occurs in the fibre lumen. • Axial dispersion in the liquid stream is negligible. • Constant volumetric flow. • Equilibrium is instant between the gas and liquid interface, and Henry's equation is applied. • The system is isothermal, and operated at a steady state. A mass balance is proceeded in the finite element of the figure. Rearrange to the general mass balance: MOLAR FLOW IN − MOLAR FLOW OUT = LOST BY REACTION 1 Rearranging and dividing by 2rrz: Take the limit as z and r tends to zero: For laminar flow: Therefore, substituting this term in equation 1: Consider the second order reaction: where: A = O2 B = H2 C = H2O The chemical reaction rate, may be defined as: Assume B is excess, therefore: The dissolved oxygen concentration profile in the system is thus defined: 2 and, EQUATION SOLVING The equation describing the dissolved oxygen profile with the chemical reaction has been solved using MATLAB. The computer program has been applied to a dimensionless for of the equation. Dimensionless form of the model The following transforms are used: together with the following dimensionless parameters: Recalling equation 3: Now, substituting the dimensionless parameters: Rearranging, and knowing that d = 2Rin : 3 The boundary conditions for this differential equation are: Using this model, the results obtained by K. Li and X. Tan (Chemical Engineering Science 56, 2001) are summarised on the following graph: DISCUSSION OF THE ENHACEMENT GAINED WITH THE CHEMICAL REACTION. In figure 1, the mass transfer coefficient (included in the Sherwood number) is plotted against the water velocity (included in the Graetz number) for different modified Hatta numbers, Nh. When Nh = 0 there is no chemical reaction. Figure 1shows that as Nh increases the curves are higher. This gives a higher value of the Sherwood number, indicating a better mass transfer coefficient, K. Figure 1 also shows that there exists an optimum value of the Graetz number for a given Nh value (greater than zero, ie with chemical reaction) at which a maximum value for Sh number is obtained. The higher Nh is, the higher Gz number will be to obtain the optimum Sh value (ie, in figure 1, for Nh=10, the optimum value of Sh number will be achieved at Gz=14, while for Nh=3 this value is achieved at Gz=6). Therefore, the optimum Sh number is only attainable at high Nh values, when the chemical reaction becomes extremely fast. When a mass transfer is enhaced by a chemical reaction, the mass transfer is thus enhaced by a factor E. Therefore, the Sherwood number is also dependent on this enhacement factor E: If the water velocity is increased, Gz will be increased: This generally increases Kl, but decreases E. With these two opposite effects, it is conceivable that an optimum Sh number at a certain Gz number is attainable when a extremely fast reaction is introduced. Therefore, it is essential to have a good control of the feed flow rate when a chemical reaction is introduced. Possible enhacement after hydrogen is used When the chemical reaction is taking place some parameters will enhace the dissolved oxygen removal more than others. The following graphs developed by K. Li and X. Tang / Chemical Engineering Science 56 (2001) show the effect of the hydrogen inlet partial pressure on the DO removal for different Hatta numbers. 4 It can be seen from both graphs that as the shell side pressure increases, the DO removal is increased. In accordance with Henry´s law, at constant total pressure, the higher the hydrogen concentration, the greater its partial pressure will be. This will create a greater potential driving force for the transfer of hydrogen into water, and thus a better removal of oxygen will be attained. The graphs also show a better DO removal with high Nh numbers, which confirms the previous discussion. Therefore, possible ways to enhace DO removal are: • Increasing hydrogen concentration. • Operating at higher values of the modified Hatta number. • Increasing the gas flow rate up to its maximum operational vlue. • Decreasing the water flow rate. In order to obtain a faster reaction, which will increase the mass transfer, we could study the effect of temperature. Recalling the modified Hatta number: A higher Nh value may be obtained with a larger inner radius of the hollow fibres. COMPARISON OF THE SIMULATION WITH EXPERIMENTAL DATA. 5 A comparison of the simulation with the results obtained by Tai et al (1994) is required now. These experimental results are obtained for a system without chemical reaction. The following two graphs show the affinity of the experimental results with the theory: In figure 1, the line Nh = 0 indicates no reaction. Therefore, it is the theoretical prediction for the model developed previously without reaction. Figure 2 shows the experimental results obtained by Tai et all for different types of fibres. It is shown on the graphs that the experimental results do well fit in the theoretical predictions. In order to get a high mass transfer coefficient (Kl), the results in figure 2 show that 0.1m in diameter fibres should be used. Fibres with lower diameters will decrease the mass transfer coefficient. NOTATION. C Liquid concentration, mol m−3 CA0 Dissolved oxygen concentration in feed water, mol m−3 D Diffusivities of gases in water, m2 s−1 • Inner diameter of hollow fibre, m Gz Graetz number, dimensionless H Henry Law constant in water, atm m3 mol−1 Kl Overall mas transfer coefficient of oxygen with no chemical reaction, m s−1 K Overall mass transfer coefficient of oxygen with chemical reaction, m s−1 L Effective fibre length, m Nh Modified Hatta number, dimensionless p. partial pressure, atm • Radius variable, m Rin Inner radius of hollow fibre, m Sh Sherwood number, dimensionless U Liquid velocity, m s−1 Um Average velocity in fibre, m s−1 Z Length variable, m • Chemical reaction rate, mol m3 s−1 6 Subscripts A Oxygen i. Oxygen and hydrogen Z=z Z=z+z Z=L r r.+r Equation 3. With chemical reaction Equation 4. Without chemical reaction Dimensionless form of the model Equation 1 Equation 2 1 1 7 10 100 10 100 Graetz number, Gz Sherwood Number, Sh Nh=0 Nh=3 Nh=5 Nh=10 Graph 1 Effect of hydrogen pressure on DO removal Nh=5 Nh=2 Figure 1 Figure 2 8 9
