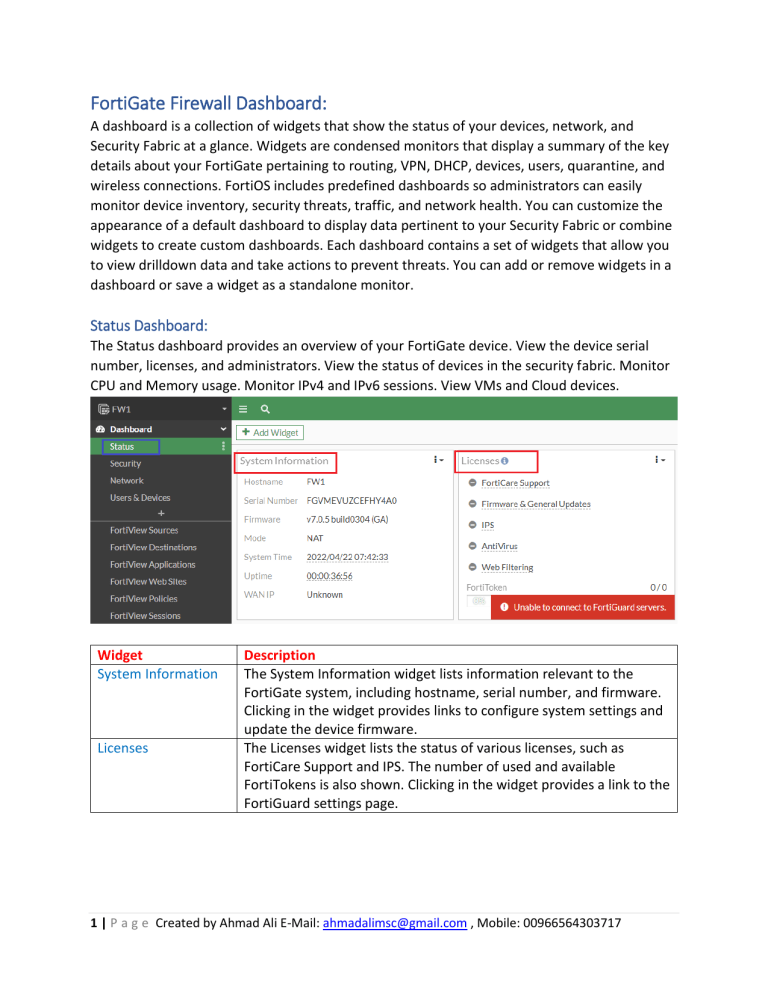
FortiGate Firewall Dashboard: A dashboard is a collection of widgets that show the status of your devices, network, and Security Fabric at a glance. Widgets are condensed monitors that display a summary of the key details about your FortiGate pertaining to routing, VPN, DHCP, devices, users, quarantine, and wireless connections. FortiOS includes predefined dashboards so administrators can easily monitor device inventory, security threats, traffic, and network health. You can customize the appearance of a default dashboard to display data pertinent to your Security Fabric or combine widgets to create custom dashboards. Each dashboard contains a set of widgets that allow you to view drilldown data and take actions to prevent threats. You can add or remove widgets in a dashboard or save a widget as a standalone monitor. Status Dashboard: The Status dashboard provides an overview of your FortiGate device. View the device serial number, licenses, and administrators. View the status of devices in the security fabric. Monitor CPU and Memory usage. Monitor IPv4 and IPv6 sessions. View VMs and Cloud devices. Widget System Information Licenses Description The System Information widget lists information relevant to the FortiGate system, including hostname, serial number, and firmware. Clicking in the widget provides links to configure system settings and update the device firmware. The Licenses widget lists the status of various licenses, such as FortiCare Support and IPS. The number of used and available FortiTokens is also shown. Clicking in the widget provides a link to the FortiGuard settings page. 1 | P a g e Created by Ahmad Ali E-Mail: [email protected] , Mobile: 00966564303717 Widget Virtual Machine Description The VM widget includes: License status and type, vCPU allocation and usage, RAM allocation and usage and VMX license information (if the VM supports VMX) Clicking on an item in the widget provides a link to the FortiGate VM License page, where license files can be uploaded. Widget Security Fabric Description The Security Fabric widget displays a visual summary of the devices in the Fortinet Security Fabric. Clicking on a product icon provides a link to a page relevancy to that product. For example, clicking the FortiAnalyzer shows a link to log settings. Widget Administrators Description This widget allows you to see logged in administrators, connected administrators, and the protocols used by each Clicking in the widget provides links to view active administrator sessions, and to open the FortiExplorer page on the App Store. 2 | P a g e Created by Ahmad Ali E-Mail: [email protected] , Mobile: 00966564303717 The resource widgets show the current usage statistics for CPU, Memory, and Sessions. Click the CPU monitor to show the per core CPU usage. Widget CPU Description This widget shows real-time CPU usage over the selected time frame. Hovering over any point on the graph displays the percentage of CPU power used at that specific time. It can be expanded to occupy the entire dashboard. Widget Memory Description This widget shows real-time memory usage over the selected time frame. Hovering over any point on the graph displays the percentage of the memory used at that specific time. It can be expanded to occupy the entire dashboard. 3 | P a g e Created by Ahmad Ali E-Mail: [email protected] , Mobile: 00966564303717 Widget Sessions Description This widget shows the current number of sessions over the selected time frame. Hovering over any point on the graph displays the number of sessions at that specific time. It can be expanded to occupy the entire dashboard. Security Dashboard: View compromised hosts and host scan summary. View top threats and vulnerabilities. Shows the session information for a compromised host. Shows the top traffic sessions aggregated by threat. Shows a summary of vulnerabilities detected by FortiClient. FortiClient must be enabled. Shows a summary of hosts scanned. Shows a summary devices aggregated by vulnerabilities. Widget Top Compromised Hosts by Verdict Description This widgets lists the compromised hosts by verdict. A FortiAnalyzer is required. It can be expanded to occupy the entire dashboard. 4 | P a g e Created by Ahmad Ali E-Mail: [email protected] , Mobile: 00966564303717 Widget Top Threats by Threat Level Description This widget lists the top threats by threat level from FortiView. It can be expanded to occupy the entire dashboard. Widget FortiClient Detected Vulnerabilities Description This widget shows the number of vulnerabilities detected by FortiClient. FortiClient must be enabled. Clicking in the widget provides a link to view the information in FortiView. This widget lists the total number of hosts. Clicking in the widget provides links to view vulnerable device in FortiView, FortiClient monitor, and the device inventory. Host Scan Summary Widget Top Vulnerable Endpoint Devices by Detected Vulnerabilities Description This widget lists the top vulnerable endpoints by the detected vulnerabilities, from FortiView. It can be expanded to occupy the entire dashboard. 5 | P a g e Created by Ahmad Ali E-Mail: [email protected] , Mobile: 00966564303717 Network: The widgets in the Network dashboard show information related to networking for this FortiGate. Monitor DHCP clients. Monitor IPsec VPN connections. Monitor current routing table. Monitor SD-WAN status. Monitor SSL-VPN connections. All of the widgets in the Network dashboard can be expanded to full screen and saved as a monitor. The Network dashboard contains the widgets Static & Dynamic Routing, DHCP, SD-WAN, Ipsec, SSL-VPN, and IP Pool Utilization. Users & Devices: The Users & Devices dashboard shows the current status of users and devices connected to your network. View users and devices connected to the network. Identify threats from individual users and devices. View FortiGuard and FortiClient data. Monitor traffic bandwidth over time. All of the widgets can be expanded to view as monitor. The User & Devices dashboard contains the widgets Device Inventory, FortiClient, Firewall Users, Quarantine, and FortiSwitch NAC VLANS. 6 | P a g e Created by Ahmad Ali E-Mail: [email protected] , Mobile: 00966564303717 Optional Widgets: The following optional widgets and many more can also be added to a dashboard. Click on + Add Widget it will open a new windows click on the widget to add or remove. You can convert a widget to a standalone monitor, change the view type, configure tables, and filter data. Hover over the widget and click Expand to full screen. Full screen mode is not supported in all widgets. 7 | P a g e Created by Ahmad Ali E-Mail: [email protected] , Mobile: 00966564303717 Dashboard Configuration: Within the Dashboard menu, Under Dashboard, click the Add Dashboard button. The Add Dashboard window opens. Enter a name in the Name field and click OK. The new dashboard opens. In the tree menu, select a dashboard. In the banner, click Add Widget. The Add Dashboard Widget pane opens. Click the Add button next to the widget. You can use the Search field to search for a widget. Enable Show More to view more widgets in a category. Configure the widget settings, then click Add Widget. Click Close. Click the Actions menu next to the dashboard and select Edit Dashboard. Edit the dashboard and click OK. Click the Actions menu next to the dashboard and select Delete Dashboard. Click Delete Dashboard. The Confirm dialog opens. Click OK. 8 | P a g e Created by Ahmad Ali E-Mail: [email protected] , Mobile: 00966564303717
