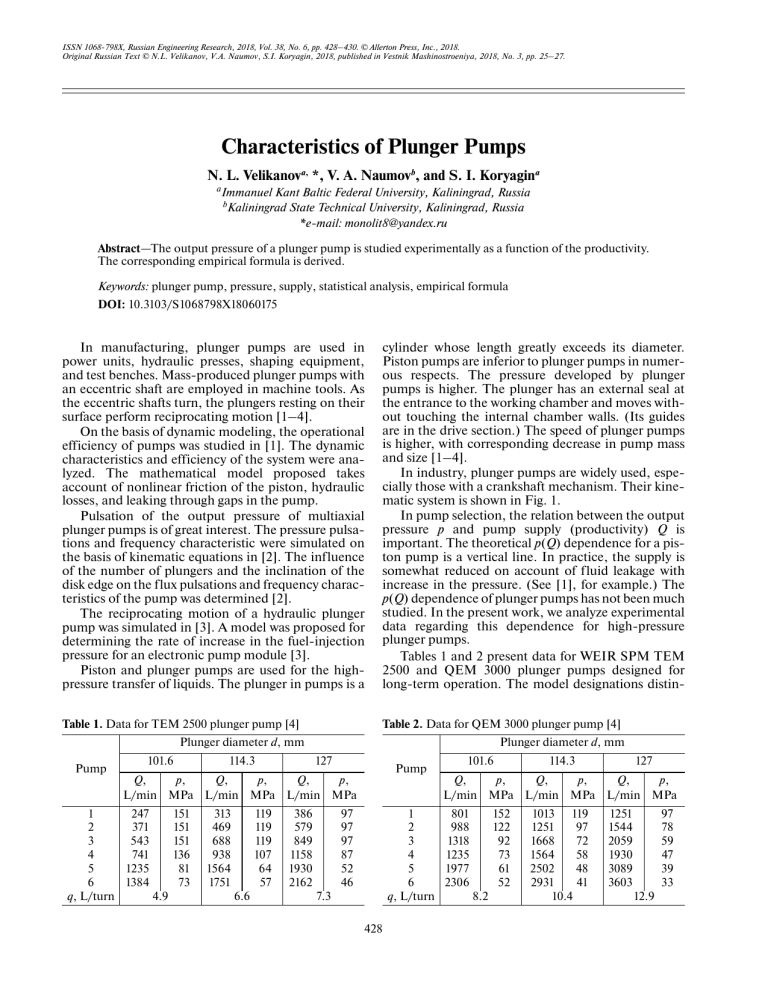
ISSN 1068-798X, Russian Engineering Research, 2018, Vol. 38, No. 6, pp. 428–430. © Allerton Press, Inc., 2018. Original Russian Text © N.L. Velikanov, V.A. Naumov, S.I. Koryagin, 2018, published in Vestnik Mashinostroeniya, 2018, No. 3, pp. 25–27. Characteristics of Plunger Pumps N. L. Velikanova, *, V. A. Naumovb, and S. I. Koryagina aImmanuel b Kant Baltic Federal University, Kaliningrad, Russia Kaliningrad State Technical University, Kaliningrad, Russia *e-mail: [email protected] Abstract—The output pressure of a plunger pump is studied experimentally as a function of the productivity. The corresponding empirical formula is derived. Keywords: plunger pump, pressure, supply, statistical analysis, empirical formula DOI: 10.3103/S1068798X18060175 In manufacturing, plunger pumps are used in power units, hydraulic presses, shaping equipment, and test benches. Mass-produced plunger pumps with an eccentric shaft are employed in machine tools. As the eccentric shafts turn, the plungers resting on their surface perform reciprocating motion [1–4]. On the basis of dynamic modeling, the operational efficiency of pumps was studied in [1]. The dynamic characteristics and efficiency of the system were analyzed. The mathematical model proposed takes account of nonlinear friction of the piston, hydraulic losses, and leaking through gaps in the pump. Pulsation of the output pressure of multiaxial plunger pumps is of great interest. The pressure pulsations and frequency characteristic were simulated on the basis of kinematic equations in [2]. The influence of the number of plungers and the inclination of the disk edge on the flux pulsations and frequency characteristics of the pump was determined [2]. The reciprocating motion of a hydraulic plunger pump was simulated in [3]. A model was proposed for determining the rate of increase in the fuel-injection pressure for an electronic pump module [3]. Piston and plunger pumps are used for the highpressure transfer of liquids. The plunger in pumps is a cylinder whose length greatly exceeds its diameter. Piston pumps are inferior to plunger pumps in numerous respects. The pressure developed by plunger pumps is higher. The plunger has an external seal at the entrance to the working chamber and moves without touching the internal chamber walls. (Its guides are in the drive section.) The speed of plunger pumps is higher, with corresponding decrease in pump mass and size [1–4]. In industry, plunger pumps are widely used, especially those with a crankshaft mechanism. Their kinematic system is shown in Fig. 1. In pump selection, the relation between the output pressure р and pump supply (productivity) Q is important. The theoretical р(Q) dependence for a piston pump is a vertical line. In practice, the supply is somewhat reduced on account of fluid leakage with increase in the pressure. (See [1], for example.) The р(Q) dependence of plunger pumps has not been much studied. In the present work, we analyze experimental data regarding this dependence for high-pressure plunger pumps. Tables 1 and 2 present data for WEIR SPM ТЕМ 2500 and QЕМ 3000 plunger pumps designed for long-term operation. The model designations distin- Table 1. Data for TEM 2500 plunger pump [4] Plunger diameter d, mm 101.6 114.3 127 Pump Q, р, Q, р, Q, р, L/min MPa L/min MPa L/min MPa 1 247 151 313 119 386 97 2 371 151 469 119 579 97 3 543 151 688 119 849 97 4 741 136 938 107 1158 87 5 1235 81 1564 64 1930 52 6 1384 73 1751 57 2162 46 q, L/turn 4.9 6.6 7.3 Table 2. Data for QEM 3000 plunger pump [4] Plunger diameter d, mm 101.6 114.3 127 Pump Q, р, Q, р, Q, р, L/min MPa L/min MPa L/min MPa 1 801 152 1013 119 1251 97 2 988 122 1251 97 1544 78 3 1318 92 1668 72 2059 59 4 1235 73 1564 58 1930 47 5 1977 61 2502 48 3089 39 6 2306 52 2931 41 3603 33 q, L/turn 8.2 10.4 12.9 428 CHARACTERISTICS OF PLUNGER PUMPS p, kPa 160 429 1 2 120 3 80 40 Fig. 1. Kinetic system of plunger pump with crankshaft mechanism. 0 p, kPa 160 5 10 15 20 25 30 35 40 Q, L/s Fig. 3. Dependence of the pressure р on Q for a TEM 2500 three-plunger pump with plunger diameter d = 101.6 (1), 114.3 (2), and 127 mm (3). 120 p, kPa 160 80 40 120 Qmax Q1 0 5 10 15 20 25 Q, L/s Fig. 2. Dependence of the output pressure р on the supply Q for a TEM 2500 three-plunger pump (d = 101.6 mm), according to experimental data [4] (points) and Eq. (1) (curve). In Fig. 2, we show the p(Q) characteristic of the WEIR SPM TEM 2500 plunger pump (with three plungers) [4]. We see that, with increase in the supply Q, the maximum pressure pmax does not change up to some value Q1. Above that value, the output pressure declines nonlinearly up to Qmax. In the range Q1–Qmax , p is almost inversely proportional to Q, according to statistical analysis of the experimental data in [4]. By the modified leastsquares method, we may select the empirical coefficients. The resulting expression takes the form Vol. 38 80 40 10 20 30 40 50 60 70 Q, L/s Fig. 4. Dependence of the pressure р on Q for a QEM 3000 five-plunger pump with plunger diameter d = 101.6 (1), 114.3 (2), and 127 mm (3). (Tables 1 and 2). In general form, these curves (Figs. 3 and 4) may be described by the formula ⎧ рmax when Q < Q1; р(Q) = ⎨ ⎩ A / Q when Q1 ≤ Q < Qmax . (2) Table 3 presents the parameter values according to Eq. (2). The mean square deviation of the experimenTable 3. Parameter values for Eq. (2) Plunger pump Parameter SPM TEM 2500 SPM QEM 3000 plunger diameter d, mm plunger diameter d, mm 101.6 101.6 114.3 101.6 101.6 114.3 (1) The р(Q) dependence is obtained analogously for other plunger diameters and for the QEM 3000 pump RUSSIAN ENGINEERING RESEARCH 3 0 guish between triplex (T) and quintuplex (Q) systems, with three and five plungers, respectively. EM pumps are designed for extended maximum operation. The figures 2500 and 3000 signify the maximum working power in horsepower (1866 and 2238 kW, respectively). In Tables 1 and 2, q denotes the output in one rotation. ⎧151 kPa when Q < 11.12 L/s; ⎪ р(Q) = ⎨1679.4 Q kPa ⎪when 11.12 ≤ Q < 23.06 L/s. ⎩ 1 2 No. 6 рmax, MPa 151 119 97 152 119 97 Q1, L/s 11.12 14.11 Qmax, L/s 23.06 29.28 36.03 38.75 49.15 61.06 17.31 13.26 16.93 20.77 A, MPa/(L/s) 1679.4 1679.4 1679.4 2015.1 2015.1 2015.1 2018 430 VELIKANOV et al. p, MPa 1000 Nuse, MW 2.0 1 1.5 8 and 9 2 10 100 3 11 1.0 7 10 3 1 and 2 0.5 4 and 5 1 0 5 10 15 20 25 30 35 40 Q, L/s 6 0.1 1 2 5 10 Fig. 5. Dependence of the useful power Nuse on Q for a TEM 2500 three-plunger pump with plunger diameter d = 101.6 (1), 114.3 (2), and 127 mm (3). 20 Q, m3/h Fig. 6. Dependence of the pressure р on Q for LEWA highpressure plunger pumps [5]. tal data from Eq. (2) is no more than 1.6%. As is evident from Table 3, A does not depend on the plunger diameter d for a particular pump model, while the maximum р value is determined by the plunger diameter and does not depend on the number of plungers. The pump’s useful power Nuse = Qp. Hence ⎧Qрmax when Q < Q1; N use (Q) = ⎨ ⎩ A when Q1 ≤ Q < Qmax . (3) According to Eq. (3) and Fig. 5, A corresponds to max the maximum useful power N use (kW) of the plunger max pump. For the TEM 2500 pump, N use = 1679.4 kW, and the pump efficiency at maximum working power max is η = N use N max = 1679.4 1866 = 0.90. Table 4. Data for LEWA high-pressure plunger pump with KA pump head [5] Theoretical Maximum flow rate, pressure, MPa m3/h Table 4 presents data for LEWA three- and fiveplunger high-pressure pumps [5]. In Fig. 6, we show the corresponding р(Q) dependence. At first glance, it seems that р(Q) is linear from Q1 to Qmax (Fig. 6). However, that is only true in logarithmic coordinates. We find that, for LEWA pumps, the р(Q) dependence is again described by Eq. (2). The only difference is in the numerical factors. The bulk efficiency of high-pressure plunger pumps may be assumed equal to one, according to the information on manufacturers’ web sites [4, 5]. This is indicated by the vertical segment of the characteristic at the maximum supply (Figs. 2–6). Note that the р(Q) dependence at the maximum supply deviates somewhat from the vertical for two-plunger pumps supplying concrete mixtures, according to experimental data. REFERENCES Curve in Fig. 6 Pump 1 G3K 80 5.8 295 75 2 G3K 90 5.8 295 90 3 G3K 110 8.4 163 110 4 G3K 130 9.5 175 130 5 G3K 160 9.5 200 160 6 G3K 200 15.5 280 200 7 G3K 250 18.9 320 250 3. Bai, Y., Fan, L., Ma, X., et al., Prediction model of the fuel injection pressure rise rate for an electronic unit pump, J. Harbin Eng. Univ., 2015, vol. 36, no. 7, pp. 932–937. 8 G3K 350 21.6 350 350 4. Weir SPM general catalog. https://www.global.weir. 9 G3K 400 21.6 350 400 10 G5K 500 25.7 350 550 5. LEWA ecoflow packed plunger-metering pump. http://www.lewa.com. 11 G5K 800 35.9 350 800 Maximum power, kW 1. Xing, M.M., Dong, S.M., Tong, Z.X., et al., Dynamic simulation and efficiency analysis of beam pumping system, J. Cent. South Univ. (Engl. Ed.), 2015, vol. 22, no. 9, pp. 3367–3379. 2. Zhenyu, X., Xuhong, M., and Hai, Z., The research on pulsation of pump pressure in water mist system, Phys. Procedia, 2015, vol. 66, pp. 73–76. Translated by Bernard Gilbert RUSSIAN ENGINEERING RESEARCH Vol. 38 No. 6 2018

![[Igor J. Karassik, Terry McGuire (auth.)] Centri(BookZZ.org)](http://s2.studylib.es/store/data/008900592_1-7fce22d32f06f46da4d1f3efd08c02c6-300x300.png)