El entrenamiento a corto plazo HIIT y Fat max aumenta la aptitud aeróbica y metabólica en hombres con obesidad de clase II y III
Anuncio
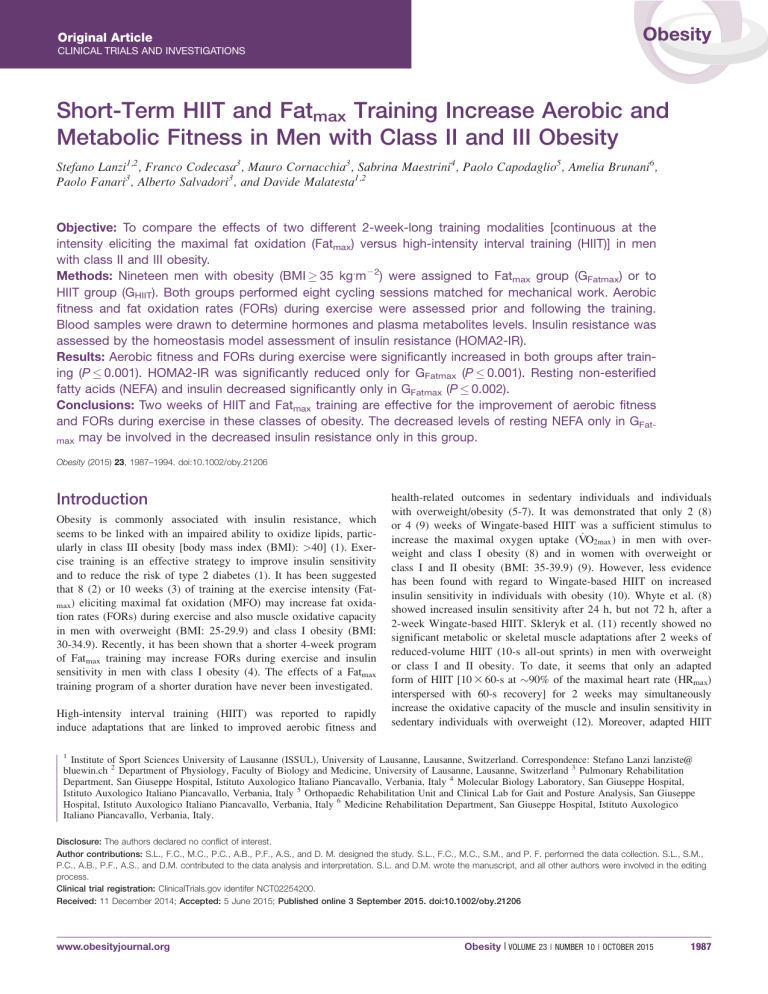
Original Article Obesity CLINICAL TRIALS AND INVESTIGATIONS Short-Term HIIT and Fatmax Training Increase Aerobic and Metabolic Fitness in Men with Class II and III Obesity Stefano Lanzi1,2, Franco Codecasa3, Mauro Cornacchia3, Sabrina Maestrini4, Paolo Capodaglio5, Amelia Brunani6, Paolo Fanari3, Alberto Salvadori3, and Davide Malatesta1,2 Objective: To compare the effects of two different 2-week-long training modalities [continuous at the intensity eliciting the maximal fat oxidation (Fatmax) versus high-intensity interval training (HIIT)] in men with class II and III obesity. Methods: Nineteen men with obesity (BMI 35 kg.m22) were assigned to Fatmax group (GFatmax) or to HIIT group (GHIIT). Both groups performed eight cycling sessions matched for mechanical work. Aerobic fitness and fat oxidation rates (FORs) during exercise were assessed prior and following the training. Blood samples were drawn to determine hormones and plasma metabolites levels. Insulin resistance was assessed by the homeostasis model assessment of insulin resistance (HOMA2-IR). Results: Aerobic fitness and FORs during exercise were significantly increased in both groups after training (P 0.001). HOMA2-IR was significantly reduced only for GFatmax (P 0.001). Resting non-esterified fatty acids (NEFA) and insulin decreased significantly only in GFatmax (P 0.002). Conclusions: Two weeks of HIIT and Fatmax training are effective for the improvement of aerobic fitness and FORs during exercise in these classes of obesity. The decreased levels of resting NEFA only in GFatmax may be involved in the decreased insulin resistance only in this group. Obesity (2015) 23, 1987–1994. doi:10.1002/oby.21206 Introduction Obesity is commonly associated with insulin resistance, which seems to be linked with an impaired ability to oxidize lipids, particularly in class III obesity [body mass index (BMI): >40] (1). Exercise training is an effective strategy to improve insulin sensitivity and to reduce the risk of type 2 diabetes (1). It has been suggested that 8 (2) or 10 weeks (3) of training at the exercise intensity (Fatmax) eliciting maximal fat oxidation (MFO) may increase fat oxidation rates (FORs) during exercise and also muscle oxidative capacity in men with overweight (BMI: 25-29.9) and class I obesity (BMI: 30-34.9). Recently, it has been shown that a shorter 4-week program of Fatmax training may increase FORs during exercise and insulin sensitivity in men with class I obesity (4). The effects of a Fatmax training program of a shorter duration have never been investigated. High-intensity interval training (HIIT) was reported to rapidly induce adaptations that are linked to improved aerobic fitness and health-related outcomes in sedentary individuals and individuals with overweight/obesity (5-7). It was demonstrated that only 2 (8) or 4 (9) weeks of Wingate-based HIIT was a sufficient stimulus to _ 2max ) in men with overincrease the maximal oxygen uptake (VO weight and class I obesity (8) and in women with overweight or class I and II obesity (BMI: 35-39.9) (9). However, less evidence has been found with regard to Wingate-based HIIT on increased insulin sensitivity in individuals with obesity (10). Whyte et al. (8) showed increased insulin sensitivity after 24 h, but not 72 h, after a 2-week Wingate-based HIIT. Skleryk et al. (11) recently showed no significant metabolic or skeletal muscle adaptations after 2 weeks of reduced-volume HIIT (10-s all-out sprints) in men with overweight or class I and II obesity. To date, it seems that only an adapted form of HIIT [10 3 60-s at 90% of the maximal heart rate (HRmax) interspersed with 60-s recovery] for 2 weeks may simultaneously increase the oxidative capacity of the muscle and insulin sensitivity in sedentary individuals with overweight (12). Moreover, adapted HIIT 1 Institute of Sport Sciences University of Lausanne (ISSUL), University of Lausanne, Lausanne, Switzerland. Correspondence: Stefano Lanzi lanziste@ bluewin.ch 2 Department of Physiology, Faculty of Biology and Medicine, University of Lausanne, Lausanne, Switzerland 3 Pulmonary Rehabilitation Department, San Giuseppe Hospital, Istituto Auxologico Italiano Piancavallo, Verbania, Italy 4 Molecular Biology Laboratory, San Giuseppe Hospital, Istituto Auxologico Italiano Piancavallo, Verbania, Italy 5 Orthopaedic Rehabilitation Unit and Clinical Lab for Gait and Posture Analysis, San Giuseppe Hospital, Istituto Auxologico Italiano Piancavallo, Verbania, Italy 6 Medicine Rehabilitation Department, San Giuseppe Hospital, Istituto Auxologico Italiano Piancavallo, Verbania, Italy. Disclosure: The authors declared no conflict of interest. Author contributions: S.L., F.C., M.C., P.C., A.B., P.F., A.S., and D. M. designed the study. S.L., F.C., M.C., S.M., and P. F. performed the data collection. S.L., S.M., P.C., A.B., P.F., A.S., and D.M. contributed to the data analysis and interpretation. S.L. and D.M. wrote the manuscript, and all other authors were involved in the editing process. Clinical trial registration: ClinicalTrials.gov identifer NCT02254200. Received: 11 December 2014; Accepted: 5 June 2015; Published online 3 September 2015. doi:10.1002/oby.21206 www.obesityjournal.org Obesity | VOLUME 23 | NUMBER 10 | OCTOBER 2015 1987 Obesity Exercise Training in Severe Obesity Lanzi et al. _ 2peak also leads to a greater early magnitude of improvement in VO compared with training at a moderate intensity in this population (13). In addition, the highest level of catecholamine secretion during (14) and after (15) high-intensity exercise might also be related, in part, to increased FORs during the post-exercise recovery period (16); this, in turn, may lead to increased insulin sensitivity (1). To our knowledge, no studies have compared the adapted HIIT with a Fatmax training program that are both matched with respect to mechanical work in men with class II and III obesity. This comparison would help determine the most appropriate short-term training stimulus to improve aerobic fitness, FORs during exercise and insulin resistance in relation to the adaptations of extra-muscular factors (hormones and plasma metabolites) that regulate fat metabolism. It has been suggested that exercise training is an effective strategy recommended in the multidisciplinary medical and surgical management of these classes of obesity (17). Exercise training can improve the lower aerobic fitness, fat oxidation during exercise [metabolic fitness (18)] and insulin resistance, that are characteristic of this population (1,17). This study aimed to compare the effects of 2-week-long training modalities (Fatmax vs. adapted HIIT), matched with respect to mechanical work, on aerobic and metabolic fitness in men with class II and III obesity. It was hypothesized that aerobic fitness, FORs during exercise and insulin resistance would be improved to a greater extent after adapted HIIT compared to Fatmax training. Methods Participants Twenty men with obesity (BMI: 35; class II: n 5 7, class III: n 5 13) were recruited as inpatients from the Istituto Auxologico Italiano, where they followed a 5-week lifestyle education program. This program included diet (balanced diet corresponding to the basal metabolic rate which was prescribed by a nutritionist and applied during the whole hospitalization), 30 min per day of recreational activities at a low intensity (walking), and a psychological follow-up. In addition to this program, the subjects performed a 2-week-long training program that began approximately 15 days after their initial hospitalization. Subjects with hypertension, impaired fasting glucose (>6.1 mmol.L21) (19), type 2 diabetes, and abnormal electrocardiogram readings were excluded. After pre-training test, subjects were assigned to two training groups [Fatmax group (GFatmax; n 5 10, class II: n 5 4, class III: n 5 6); adapted HIIT group (GHIIT; n 5 10, class II: n 5 3, class III: _ 2peak n 5 7)] matched for age, BMI, both absolute and relative VO values, and diet. For personal reasons, one subject dropped out of the GHIIT; however, the characteristics of the two training groups remained similar. The balanced diet and the macronutrient proportions were similar between groups (Table 1). The study was approved by the Ethics Review Committee of the institute. All subjects provided written and voluntary informed consent before participation. Maximal ramp incremental test. The peak power output (PPOrwas determined by a maximal ramp incremental test to exhaustion on a cycle-ergometer (Ebike Basic BPlus, USA), as previously described (20). amp) Pre-training test. The experimental trial was performed a minimum of 2 days after the maximal ramp incremental test and was performed in the morning after 12-h overnight fast. The subjects remained seated for 15 min on the cycle-ergometer and were connected to the metabolic system (rest). Thereafter, subjects performed a maximal incremental test (Incr) to determine the whole-body fat oxidation kinetics, Fatmax and CHO oxidation rates in the first phase (IncrP1) and the maximal parameters in the second phase (IncrP2) of the test. After a standardized 10-min warm-up at 20% PPOramp, the PO increased by 10% PPOramp every 5 min until 70% PPOramp was reached or until the respiratory exchange ratio (RER) reached 1.0 [IncrP1; adapted from Lanzi et al. (20)]. The HR and respiratory values were averaged over the last minute of each stage. At this point, the PO was increased by 15 W every minute until exhaustion _ 2peak , PPOIncr, and HRmax (IncrP2). Blood samples to determine VO were drawn at rest and during the last 3 min of the last step of IncrP1 to determine serum insulin and non-esterified fatty acids (NEFA), plasma glycerol, epinephrine (E), norepinephrine (NE), glucose and lactate ([La-]) concentrations. According to Bordenave et al. (21), we used long duration stages and, from our previous data (20), we determined that 5-min duration was enough to reach a steady-state in this population. Exercise training. The training intervention consisted of eight cycling sessions spread over 14 days. For the GHIIT, each session consisted of 10x60-s cycling intervals at workload eliciting 90% HRmax interspersed with 60-s recovery at 50 W (22). Each session included a 5-min warm-up and cool-down at 50 W, for a total of 30 min. To match both training groups with respect to mechanical work during the exercise training session, for GFatmax each session consisted of 40-50 min of continuous exercise with an intensity that corresponded to the individual Fatmax. The exercise sessions were supervised and the HR of the subjects was continuously monitored throughout the exercise session (Polar RS800, Finland). Subjects were asked to rate their perceived exertion (RPE) during exercise (GFatmax: each 10 min; GHIIT: at the end of each interval) using Borg’s scale (0-10) and the average of the session was calculated. The perceived enjoyment of the training sessions was assessed at the end of each training session by an arbitrary scale that ranged from 0 (not enjoyable at all) to 10 (very enjoyable) (22). Post-training test. After the last training session (GFatmax: 3.9 6 0.4 days; GHIIT: 3.2 6 0.4 days, non-significant) subjects performed Incr, which was set at the same absolute workload as the pretraining test. Blood samples were collected at the same absolute workload as during the pre-training test (at rest and at the end of IncrP1Pre). Data analysis and calculations Experimental design The 5-week lifestyle education program was planned as follow: (i) during the first week subjects had clinical routine analysis; (ii) during the second week subjects underwent the pre-training tests; (iii) during the third and fourth week subjects performed the training program; (iv) during the fifth week subjects underwent the post-training tests. 1988 Obesity | VOLUME 23 | NUMBER 10 | OCTOBER 2015 _ 2 , carbon dioxide production VO _ _ (VCO2 ) and ventilation (V E ) were measured continuously using a breath-by-breath online system (Vmax 229, Sensor Medics, USA). _ 2peak was defined as the highest 10-s mean value recorded VO before the subject’s volitional termination of Incr. PPOIncr and HRmax were defined as the highest peak values reached during the test. Gas exchange, PPO, and HR. www.obesityjournal.org Original Article Obesity CLINICAL TRIALS AND INVESTIGATIONS TABLE 1 Effect of training on anthropometric measurements, aerobic fitness and whole-body fat oxidation kinetics in the Fatmax training (GFatmax) and adapted high-intensity interval training (HIIT: GHIIT) groups GFatmax (n 5 10) PRE Age, years Height, m Diet, kcal.day21 Dietary CHO, % Dietary fat, % Dietary protein, % Body mass, kg BMI, kg.m22 Fasting glucose, mmol.L21 Fasting insulin, mU.L21 HOMA2-IR, mmol.mU.L22 Fasting NEFA, mmol.L21 Exercise parameters _ 2peak, mL.min21 VO _ 2peak, mL.min21.kg21 VO HRmax, bpm PPOIncr, W Whole-body fat oxidation Resting FORs, g.min21 Resting FORs, mg.kg21.min21 MFO, g.min21 MFO, mg.kg21.min21 Fatmax, %PPOIncrPre _ 2maxPre Fatmax, %VO Fatmax, %HR Dilatation Symmetry Translation GHIIT (n 5 9) Significance POST PRE POST Group Time G3T 38.1 6 2.3 1.74 6 0.02 1970 6 56 55.8 6 0.3 23.7 6 0.5 20.5 6 0.3 124.1 6 4.5 40.9 6 1.1 5.3 6 0.1 28.7 6 3.0 3.6 6 0.4 1125.0 6 84.1 120.4 6 4.6 39.7 6 1.1 5.2 6 0.1 22.1 6 2.6§ 2.8 6 0.3§ 820.0 6 62.9§ 34.9 6 3.4 1.76 6 0.03 2056 6 60 56.1 6 0.5 23.6 6 0.4 20.3 6 0.2 133.0 6 4.8 43.1 6 1.0 5.4 6 0.2 22.4 6 2.9 2.9 6 0.4 988.9 6 38.9 129.0 6 4.7 41.8 6 1.0 5.2 6 0.2 21.9 6 3.5 2.8 6 0.4 1028.9 6 101.1 NS NS NS NS NS NS 0.001 0.001 NS 0.02 0.02 0.054 NS NS NS 0.04 0.04 0.02 2857 6 151 23.1 6 1.2 168 6 5 161 6 10 2983 6 166 24.9 6 1.2 172 6 5 179 6 12 3179 6 104 24.1 6 1.2 180 6 5 183 6 7 3439 6 119 26.9 6 1.2 179 6 4 213 6 9 NS NS NS NS 0.001 0.001 NS 0.001 NS NS NS NS 0.12 6 0.02 0.92 6 0.12 0.43 6 0.04 3.5 6 0.3 38.8 6 3.2 48.8 6 2.9 66.6 6 2.2 0.1 6 0.1 0.8 6 0.1 0.1 6 0.1 0.12 6 0.02 1.01 6 0.14 0.46 6 0.03 3.9 6 0.2 47.9 6 3.5 54.7 6 2.8 67.8 6 1.8 0.4 6 0.1 1.0 6 0.1 0.0 6 0.1 0.15 6 0.01 1.12 6 0.05 0.45 6 0.01 3.5 6 0.2 44.7 6 4.3 52.3 6 2.7 68.6 6 1.4 0.4 6 0.2 0.9 6 0.1 0.0 6 0.1 0.15 6 0.01 1.20 6 0.09 0.53 6 0.02 4.1 6 0.2 52.2 6 2.3 57.7 6 2.0 68.7 6 1.2 0.6 6 0.1 0.9 6 0.0 20.2 6 0.1 NS NS NS NS NS NS NS NS NS NS NS NS 0.005 0.001 0.002 0.01 NS 0.004 NS 0.03 NS NS NS NS NS NS NS NS NS NS Values are the means 6 SE. BMI: body mass index; CHO: carbohydrates; Fatmax: exercise training intensity at which the maximal fat oxidation rate (MFO) occurs; FORs: fat oxidation rates; HOMA2IR: homeostasis model assessment of insulin resistance; HRmax: maximal heart rate; NEFA: non-esterified fatty acids; PPOIncr: peak power output reached during the max_ 2peak : peak oxygen uptake. imal incremental test (Incr); VO § P 0.05 for significant differences between the pre- and post-training conditions for GFatmax; NS: not significant; G 3 T: group 3 time interaction effect for two-way repeated-measures ANOVA. Indirect calorimetry. FORs and CHO oxidation rates were calculated with stoichiometric equations (23). The results of IncrP1 were used to calculate FORs over a wide range of exercise intensities. To model whole-body fat oxidation kinetics [% of the pretraining PPOIncr (PPOIncrPre)] and to determine Fatmax and MFO, the SIN model (24), which includes three independent variables that represent the main quantitative characteristics of the curve (dilatation, symmetry, translation), was used as previously described (20). CHO oxidation rates (%PPOIncrPre) were calculated using a polynomial fitting curve. Blood samples. The blood samples were collected through an indwelling cannula inserted into the antecubital vein and plasma hormones and metabolites concentrations were determined as previously described (20). Insulin resistance was assessed by the www.obesityjournal.org updated homeostasis model assessment of insulin resistance (HOMA2-IR) (25). Statistical analysis A three-way repeated-measures ANOVA (time 3 group 3 exercise intensity) was performed to compare the RER, HR, V_ E , FORs and CHO oxidation rates at each relative exercise intensity (%PPOIncrPre) [time 3 group 3 exercise intensity (n 5 15; 10-80% PPOIncrPre)] and to compare the plasma concentrations of metabolites and hormones [time 3 group 3 exercise intensity (n 5 2; rest-end of IncrP1Pre)]. A two-way repeated-measures ANOVA (time 3 group) was used to identify the differences in the average from all 15 stages for FORs, RER and CHO oxidation rates, in the variables of the SIN model, Fatmax, MFO, peak parameters, HOMA2-IR and anthropometric measures. The significance was determined with a ttest, with Bonferroni adjustment where appropriate, when ANOVA Obesity | VOLUME 23 | NUMBER 10 | OCTOBER 2015 1989 Obesity Exercise Training in Severe Obesity Lanzi et al. TABLE 2 Descriptive characteristics of training programs in the Fatmax training (GFatmax) and adapted high-intensity interval training (HIIT: GHIIT) groups Variable GFatmax (n 5 10) GHIIT (n 5 9) 90 Prescribed exercise intensity 66.6 6 2.2 during effort, %HRmax 69.7 6 1.4 89.5 6 1.1 Actual exercise intensity during effort, %HRmax Frequency, session/week 4 4 Time, min/session 42.0 6 1.3 30.0 6 0.0 Time, min/week 168 6 5 120 6 0 Adherence, % 100.0 6 0.0 98.6 6 1.4 Mechanical work, KJ 1274 6 102 1404 6 53 Perceived enjoyment 8.2 6 0.4 8.9 6 0.2 RPE 3.3 6 0.5 4.9 6 0.3 Significance 0.001 0.001 0.001 NS NS NS 0.009 Values are the means 6 SE. Fatmax: exercise training intensity at which maximal fat oxidation rate occurs; HRmax: maximal heart rate; RPE: rate of perceived exertion; NS: non-significant. Adherence to training was calculated as a percentage by dividing the number of the completed sessions by the total number of sessions. revealed significant interaction effects. A t-test was also used to compare the descriptive characteristics of the training programs. When ANOVA revealed significant interaction effects, ANCOVA, including pre-training values as co-variate, were assessed. Cohen’s d values were used as an effect size (ES) index and were calculated to examine the significance of the training improvements within each group. Statistical significance was set at P 0.05. Results Anthropometric measurements and maximal exercise parameters These measurements are shown in Table 1. Before the training, body mass, HRmax and PPOIncr were not different between groups. In response to training, the body mass and BMI decreased signifi_ 2peak increased significantly in both cantly in both groups. The VO groups, with a large ES (d 5 0.82) for GHIIT and a small ES (d 5 0.27) for GFatmax. The HRmax showed no significant differences between groups, whereas the PPOIncr increased significantly in both groups. For these variables, there was no significant time 3 group interaction effect. Characteristics of training These measurements are shown in Table 2. Participants in GFatmax exercised for a significantly greater duration but at significantly lower exercise intensity than participants in GHIIT. The adherence to the training program, mechanical work and average perceived enjoyment of the training sessions were similar in both groups. The average RPE during the training sessions was significantly higher for GHIIT compared to GFatmax. 1990 Obesity | VOLUME 23 | NUMBER 10 | OCTOBER 2015 Gas exchange and whole-body substrate oxidation (IncrP1) Before the training, V_ E , RER, CHO oxidation rates, FORs, the wholebody fat oxidation kinetics (SIN variables, MFO and Fatmax) during exercise, and resting FORs were not different between groups. In response to training, resting FORs (Table 1) and V_ E during exercise (data not shown) remained unchanged in both groups. RER during exercise decreased significantly in both groups (time effect: P 0.001, Figure 1A) and FORs during exercise increased significantly in both groups (time effect: P 0.001; Figures 1B and C). CHO oxidation rates during exercise decreased significantly in both groups (time effect: P 0.001; Figures 1E and F). For these variables, there was no significant time 3 group 3 exercise intensity interaction effect. When the average from all 15 stages was performed, FORs during exercise increased, whereas CHO oxidation rates and RER during exercise decreased significantly in both groups after intervention (time effect: P 0.001, data not shown). After the intervention, whole-body fat oxidation kinetics during exercise were characterized by similar symmetry and by a significantly greater dilatation and right-shift translation in both groups (Table 1, Figure 1D). The MFO increased significantly in both groups (Table 1), with a large ES (d 5 1.49) for GHIIT and a small ES (d 5 0.32) for GFatmax. Fatmax increased significantly in both groups (Table 1). For these variables, there was no significant time 3 group interaction effect. Plasma metabolite and hormonal concentrations (IncrP1) Before the training, the concentrations of metabolites and hormones in the plasma were not different between groups. After the intervention, the concentrations of plasma NEFA decreased significantly only for GFatmax (time 3 group interaction effect: P 5 0.01; Figure 2A) due to decreased resting concentrations of NEFA (225%; Table 1; P 5 0.002); however, this parameter remained similar for GHIIT. The co-variate, the pre-training resting plasma NEFA values, was not significantly related to the post-training resting values (P 5 0.25), and the difference between groups remained significant (P 5 0.05). The concentrations of plasma glycerol and glucose showed no significant differences in either group (Figures 2B and C). The concentrations of plasma lactate (time effect: P 5 0.001; Figure 2D) and plasma E and NE (time effect: P 0.02; Figures 3A and B) decreased significantly in both groups. For these variables, there was no significant time 3 group 3 exercise intensity interaction effect. Plasma fasting insulin levels decreased significantly (224%) at rest only in GFatmax (time 3 group 3 exercise intensity interaction effect: P 5 0.04; Figure 3C, Table 1). The co-variate, the pre-training resting plasma insulin values, was significantly related to the post-training values (P 0.001); however, the difference between groups tended to be significant (P 5 0.09). HOMA2-IR showed a significant time 3 group interaction effect and decreased significantly only in GFatmax (P 0.001; Table 1). The co-variate, the pre-training HOMA2-IR values, was significantly related to the post-training values (P 0.001); however, the difference between groups tended to be significant (P 5 0.099). Discussion This study showed that both 2 weeks of adapted HIIT and Fatmax training are effective in improving aerobic fitness and FORs during exercise in men with class II and III obesity. The aerobic fitness and www.obesityjournal.org Original Article Obesity CLINICAL TRIALS AND INVESTIGATIONS Figure 1 The mean (A) respiratory exchange ratio (RER), whole-body fat oxidation kinetics in absolute [(B) g.min21 and (C) mg.kg21.min21] and (D) relative [% of maximal fat oxidation (MFO)] values, and carbohydrate (CHO) oxidation rates in absolute [(E) g.min21 and (F) mg.kg21.min21] values in pre- and post-training conditions expressed as a function of the pre-training peak power output reached during the maximal incremental test (PPOIncrPre) in the Fatmax training (GFatmax) and adapted high-intensity interval training (HIIT: GHIIT) groups. Values are the means 6 SE. *P 0.05 for the significant time effect. FORs were not improved to a greater extent after adapted HIIT, which was, however, feasible and beneficial for this population. In addition, the decreased levels of resting plasma NEFA observed only after Fatmax training may be a potential mechanism involved in decreased insulin resistance only in this group. _ 2peak increased in both groups after 2 weeks of intervention. VO Although there was no significant difference between groups, most www.obesityjournal.org likely related to small sample size (statistical power: 34%), the magni_ 2peak was 8% in GHIIT and 4% in GFatmax. tude of the increase in VO Moreover, ES analyses revealed a large ES for GHIIT and a small ES for GFatmax. Thus, our results suggest that the adapted HIIT had a tendency toward promoting a more marked increase in aerobic fitness compared to Fatmax training. This improvement may be related to the _ 2peak is in agreement exercise intensity (26). This rapid increase in VO with previous findings that suggested that high-intensity training may Obesity | VOLUME 23 | NUMBER 10 | OCTOBER 2015 1991 Obesity Exercise Training in Severe Obesity Lanzi et al. Figure 2 The mean concentrations of (A) non-esterified fatty acids (NEFA), (B) glycerol, (C) glucose, and (D) lactate at rest and at the end of the first phase of the pre-training maximal incremental test (IncrP1Pre) in pre- and post-training conditions in the Fatmax training (GFatmax) and adapted high-intensity interval training (HIIT: GHIIT) groups. Values are the means 6 SE. The values at IncrP1Pre correspond to 75% of the peak power output reached during the pre-training Incr. ‡P 0.05 for the significant time 3 group interaction effect for GFatmax; *P 0.05 for the significant time effect. _ 2peak compared be preferable for the induction of early changes in VO with moderate exercise training (13). After the intervention, FORs during exercise were higher and whole-body fat oxidation kinetics were characterized by a greater dilatation and right-shift translation in both groups. We recently showed that men with obesity and severe obesity presented a lower Fatmax and reliance on fat oxidation compared to their lean counterparts (20). These findings demonstrated that only 2 weeks of training may increase Fatmax and FORs, which suggests that fat oxidation may rapidly improve in this population. The increased FORs may be attributable to a similar increase in mitochondrial enzyme activities and/or content in response to both training modalities (27). _ 2peak , we observed a large ES in However, consistent with the VO GHIIT and a small ES in GFatmax for the MFO (statistical power: 28%), highlighting the primacy of exercise intensity in the improvement of fat oxidation during exercise in men with class II and III obesity. This finding is in agreement with recent results that suggested a greater mitochondrial biogenesis following higher compared with a work-matched bout of lower exercise intensity (28). The training adaptations of fat metabolism may also be related to extra-muscular factors (29). However, although the catecholamine response after training presented a significant reduction [probably because it was assessed at the same absolute exercise intensity 1992 Obesity | VOLUME 23 | NUMBER 10 | OCTOBER 2015 (14)], the concentration of plasma glycerol (lipolytic index) remained similar at rest and during exercise after both types of training. The lack of changes in lipolysis concomitant with increased FORs during exercise may improve the mismatching between the availability and oxidation of NEFA in individuals with obesity, suggesting that the regulation of fat metabolism in the early phase of exercise training may be principally related to muscular, rather than extra-muscular, factors (30). Our results are in agreement with previous studies that reported decreased insulin resistance after Fatmax training (4), highlighting the clinical relevance of Fatmax training in the treatment of obesity (31). In fact, HOMA2-IR decreased significantly only in GFatmax (statistical power: 60%) and this difference tended to be significant after the inclusion of baseline values as co-variate, demonstrating the importance of this change in GFatmax even in our small sample size. These results suggest that insulin resistance shows a significant decrease in GFatmax compared to GHIIT. This may be related, in part, to decreased levels of resting plasma NEFA after training (225%) observed only in GFatmax, which remain significant even after covariance analysis. This result is consistent with previous studies showing an increase in insulin sensitivity after a pharmacological decrease in plasma NEFA levels (32). We can speculate that, with respect to adapted HIIT, Fatmax training may lead to an increased www.obesityjournal.org Original Article Obesity CLINICAL TRIALS AND INVESTIGATIONS degrading enzyme (36). Taken together our findings may suggest the pivotal role of fat oxidation during the exercise session in the improvement of insulin resistance in men with class II and III obesity. On the other hand, HIIT did not improve insulin resistance in this population. This in agreement with previous results using reduced-volume HIIT (8,11) and adapted HIIT (37) in men with overweight/obesity but in contrast to others using adapted HIIT in sedentary adults with overweight (12) and in patients with type 2 diabetes (22). The lack of a consistent response after HIIT may be related to the different classes of obesity tested in these studies or to a lower training stimulus (11). It has been suggested that the exercise duration is the most important determinant when the training is designed to induce improvement in insulin sensitivity in sedentary adults with overweight/obesity (38). Some methodological limitations need to be addressed. Firstly, although it has been demonstrated a strong agreement between the estimates of substrate oxidation rates measured with indirect calo_ 2max in rimetry and by an isotope method during exercise at 85% VO cyclists (39), this, to our knowledge, has never been validated in individuals with obesity and need, therefore, further investigations. However, the indirect calorimetry has been widely used in this population to assess FORs during exercise (2-4,20). Secondly, this study lacks of a control group (enrolled in the lifestyle intervention but not in exercise training) to directly assess the potential health adaptations of these two training modalities and to avoid the confounding influence of the lifestyle intervention. Indeed, our subjects followed a lifestyle education program, which included balanced diet control and weight loss, and this might have influenced our results [especially decrease insulin resistance (40)]. Thirdly, because of the small sample size (and low statistical power), it was not possible to detect a significant different adaptation between the two groups for the _ 2peak and MFO). However, our results main variables (i.e., VO (attested by ES) seem to suggest a greater increase of these variables after adapted HIIT compared to Fatmax training, highlighting the potential pivotal role of the high-intensity training in this population. Figure 3 The mean concentrations of (A) epinephrine, (B) norepinephrine, and (C) insulin at rest and at the end of the first phase of the pre-training maximal incremental test (IncrP1Pre) in pre- and post-training conditions in the Fatmax training (GFatmax) and adapted high-intensity interval training (HIIT: GHIIT) groups. Values are the means 6 SE. The values at IncrP1Pre correspond to 75% of the peak power output reached during the pre-training Incr. *P 0.05 for significant time effect; †P 0.05 for the significant time 3 group 3 exercise intensity interaction effect; §P 0.05 for the significant difference between the pre- and post-training conditions for GFatmax. In summary, 2 weeks of adapted HIIT and Fatmax training are both effective for the improvement of aerobic fitness and FORs during exercise in men with class II and III obesity. In addition, decreased plasma NEFA at rest only in GFatmax may provide, in part, a mechanism involved in decreased fasting insulin and insulin resistance in this group. Further research is needed to investigate the long-term effects of these two training modalities in this population. Acknowledgments capacity to oxidize intra-muscular triglycerides (IMTG) in our subjects, as previously reported (33). This might induce IMTG turnover, which may be involved in the reduction of plasma NEFA levels [most likely used to restore the IMTG pool (33)] and accumulation of lipotoxic intermediates, which may contribute to the increase in insulin sensitivity (34). The post-training decline in plasma NEFA in GFatmax may be also involved in the decreased fasting plasma insulin [a marker of insulin sensitivity (35)] found only in this group. After weight loss programs, the lower plasma insulin concentration may be associated to an increase in insulin clearance from plasma through a decreased inhibition of plasma NEFA on insulin- www.obesityjournal.org The authors thank Cinzia Parisio for the planning of the training sessions, Lele Baldo for his helpful assistance during the training sessions, Andre Berchtold for statistical assistance, and all the volunteers for their participation. C 2015 The Obesity Society V References 1. Houmard JA, Pories WJ, Dohm GL. Severe obesity: evidence for a deranged metabolic program in skeletal muscle? Exerc Sport Sci Rev 2012;40:204-210. 2. Dumortier M, Brandou F, Perez-Martin A, Fedou C, Mercier J, Brun JF. Low intensity endurance exercise targeted for lipid oxidation improves body composition Obesity | VOLUME 23 | NUMBER 10 | OCTOBER 2015 1993 Obesity 3. 4. 5. 6. 7. 8. 9. 10. 11. 12. 13. 14. 15. 16. 17. 18. 19. 20. 21. Exercise Training in Severe Obesity Lanzi et al. and insulin sensitivity in patients with the metabolic syndrome. Diabetes Metab 2003;29:509-518. Bordenave S, Metz L, Flavier S, et al. Training-induced improvement in lipid oxidation in type 2 diabetes mellitus is related to alterations in muscle mitochondrial activity. Effect of endurance training in type 2 diabetes. Diabetes Metab 2008;34:162-168. Venables MC, Jeukendrup AE. Endurance training and obesity: effect on substrate metabolism and insulin sensitivity. Med Sci Sports Exerc 2008;40:495-502. Gibala MJ, Little JP, Macdonald MJ, Hawley JA. Physiological adaptations to lowvolume, high-intensity interval training in health and disease. J Physiol 2012;590: 1077-1084. Gillen JB, Gibala MJ. Is high-intensity interval training a time-efficient exercise strategy to improve health and fitness? Appl Physiol Nutr Metab 2014;39:409-412. Weston KS, Wisloff U, Coombes JS. High-intensity interval training in patients with lifestyle-induced cardiometabolic disease: a systematic review and metaanalysis. Br J Sports Med 2014;48:1227-1234. Whyte LJ, Gill JM, Cathcart AJ. Effect of 2 weeks of sprint interval training on health-related outcomes in sedentary overweight/obese men. Metabolism 2010;59: 1421-1428. Trilk JL, Singhal A, Bigelman KA, Cureton KJ. Effect of sprint interval training on circulatory function during exercise in sedentary, overweight/obese women. Eur J Appl Physiol 2011;111:1591-1597. Gibala MJ, Little JP. Just HIT it! A time-efficient exercise strategy to improve muscle insulin sensitivity. J Physiol 2010;588:3341-3342. Skleryk JR, Karagounis LG, Hawley JA, Sharman MJ, Laursen PB, Watson G. Two weeks of reduced-volume sprint interval or traditional exercise training does not improve metabolic functioning in sedentary obese men. Diabetes Obes Metab 2013; 15:1146-1153. Hood MS, Little JP, Tarnopolsky MA, Myslik F, Gibala MJ. Low-volume interval training improves muscle oxidative capacity in sedentary adults. Med Sci Sports Exerc 2011;43:1849-1856. Astorino TA, Schubert MM, Palumbo E, et al. Magnitude and time course of changes in maximal oxygen uptake in response to distinct regimens of chronic interval training in sedentary women. Eur J Appl Physiol 2013;113:2361-2369. Zouhal H, Jacob C, Delamarche P, Gratas-Delamarche A. Catecholamines and the effects of exercise, training and gender. Sports Med 2008;38:401-423. Trapp EG, Chisholm DJ, Boutcher SH. Metabolic response of trained and untrained women during high-intensity intermittent cycle exercise. Am J Physiol Regul Integr Comp Physiol 2007;293:R2370-R2375. Boutcher SH. High-intensity intermittent exercise and fat loss. J Obes 2011;2011: 868305. Baillot A, Audet M, Baillargeon JP, et al. Impact of physical activity and fitness in class II and III obese individuals: a systematic review. Obes Rev 2014;15:721-739. Nordby P, Saltin B, Helge JW. Whole-body fat oxidation determined by graded exercise and indirect calorimetry: a role for muscle oxidative capacity? Scand J Med Sci Sports 2006;16:209-214. The Expert Committee on the Diagnosis and Classification of Diabetes Mellitus. Report of the Expert Committee on the Diagnosis and Classification of Diabetes Mellitus (Committee Report). Diabetes Care 1998;21(Suppl 1): S5-S19. Lanzi S, Codecasa F, Cornacchia M, et al. Fat oxidation, hormonal and plasma metabolite kinetics during a submaximal incremental test in lean and obese adults. PLoS One 2014;9:e88707. Bordenave S, Flavier S, Fedou C, Brun JF, Mercier J. Exercise calorimetry in sedentary patients: procedures based on short 3 min steps underestimate carbohydrate oxidation and overestimate lipid oxidation. Diabetes Metab 2007;33: 379-384. 1994 Obesity | VOLUME 23 | NUMBER 10 | OCTOBER 2015 22. Little JP, Gillen JB, Percival ME, et al. Low-volume high-intensity interval training reduces hyperglycemia and increases muscle mitochondrial capacity in patients with type 2 diabetes. J Appl Physiol 2011;111:1554-1560. 23. Frayn KN. Calculation of substrate oxidation rates in vivo from gaseous exchange. J Appl Physiol 1983;55:628-634. 24. Cheneviere X, Malatesta D, Peters EM, Borrani F. A mathematical model to describe fat oxidation kinetics during graded exercise. Med Sci Sports Exerc 2009; 41:1615-1625. 25. Levy JC, Matthews DR, Hermans MP. Correct homeostasis model assessment (HOMA) evaluation uses the computer program. Diabetes Care 1998;21:2191-2192. 26. Helgerud J, Hoydal K, Wang E, et al. Aerobic high-intensity intervals improve VO2max more than moderate training. Med Sci Sports Exerc 2007;39:665-671. 27. Gibala MJ, Little JP, van Essen M, et al. Short-term sprint interval versus traditional endurance training: similar initial adaptations in human skeletal muscle and exercise performance. J Physiol 2006;575:901-911. 28. Egan B, Carson BP, Garcia-Roves PM, et al. Exercise intensity-dependent regulation of peroxisome proliferator-activated receptor coactivator-1 mRNA abundance is associated with differential activation of upstream signalling kinases in human skeletal muscle. J Physiol 2010;588:1779-1790. 29. de Glisezinski I, Moro C, Pillard F, et al. Aerobic training improves exerciseinduced lipolysis in SCAT and lipid utilization in overweight men. Am J Physiol Endocrinol Metab 2003;285:E984-E990. 30. Horowitz JF. Regulation of lipid mobilization and oxidation during exercise in obesity. Exerc Sport Sci Rev 2001;29:42-46. 31. Brun JF, Malatesta D, Sartorio A. Maximal lipid oxidation during exercise: A target for individualizing endurance training in obesity and diabetes? J Endocrinol Invest 2012;35:686-691. 32. Bajaj M, Suraamornkul S, Romanelli A, et al. Effect of a sustained reduction in plasma free fatty acid concentration on intramuscular long-chain fatty Acyl-CoAs and insulin action in type 2 diabetic patients. Diabetes 2005;54:3148-3153. 33. van Aggel-Leijssen DP, Saris WH, Wagenmakers AJ, Senden JM, van Baak MA. Effect of exercise training at different intensities on fat metabolism of obese men. J Appl Physiol 2002;92:1300-1309. 34. Moro C, Bajpeyi S, Smith SR. Determinants of intramyocellular triglyceride turnover: implications for insulin sensitivity. Am J Physiol Endocrinol Metab 2008; 294:E203-E213. 35. Schenk S, Harber MP, Shrivastava CR, Burant CF, Horowitz JF. Improved insulin sensitivity after weight loss and exercise training is mediated by a reduction in plasma fatty acid mobilization, not enhanced oxidative capacity. J Physiol 2009; 587:4949-4961. 36. Villareal DT, Banks MR, Patterson BW, Polonsky KS, Klein S. Weight loss therapy improves pancreatic endocrine function in obese older adults. Obesity (Silver Spring) 2008;16:1349-1354. 37. Boyd JC, Simpson CA, Jung ME, Gurd BJ. Reducing the intensity and volume of interval training diminishes cardiovascular adaptation but not mitochondrial biogenesis in overweight/obese men. PLoS One 2013;8:e68091. 38. Houmard JA, Tanner CJ, Slentz CA, Duscha BD, McCartney JS, Kraus WE. Effect of the volume and intensity of exercise training on insulin sensitivity. J Appl Physiol 2004;96:101-106. 39. Romijn JA, Coyle EF, Hibbert J, Wolfe RR. Comparison of indirect calorimetry and a new breath 13C/12C ratio method during strenuous exercise. Am J Physiol 1992;263:E64-E71. 40. Kelley DE, Goodpaster B, Wing RR, Simoneau JA. Skeletal muscle fatty acid metabolism in association with insulin resistance, obesity, and weight loss. Am J Physiol 1999;277:E1130-E1141. www.obesityjournal.org
