0895- 7177J93 $6.00 + 0.00
Mafhl. Comput. Modelling Vol. 17, No. 415, pp. 13-18, 1993 zyxwvutsrqponmlkjihgfedcbaZYXWVUTSRQPON
Copyright@ 1993 Pergamon Press Ltd zyxwvutsrqpon
Printed in Great Britain. All rights reserved
EXPERIMENTS
REVERSAL
ON RANK PRESERVATION
AND
IN RELATIVE
MEASUREMENT
THOMAS
L. SAATY
Joseph M. Katz Graduate School of Business, 322 Mervis Hall
University of Pittsburgh, Pittsburgh, PA 15260, U.S.A.
Lurs
G.
VARGAS
Joseph M. Katz Graduate School of Business, 314 Mervis Hall
University of Pittsburgh, Pittsburgh, PA 15260, U.S.A.
Abstract-We
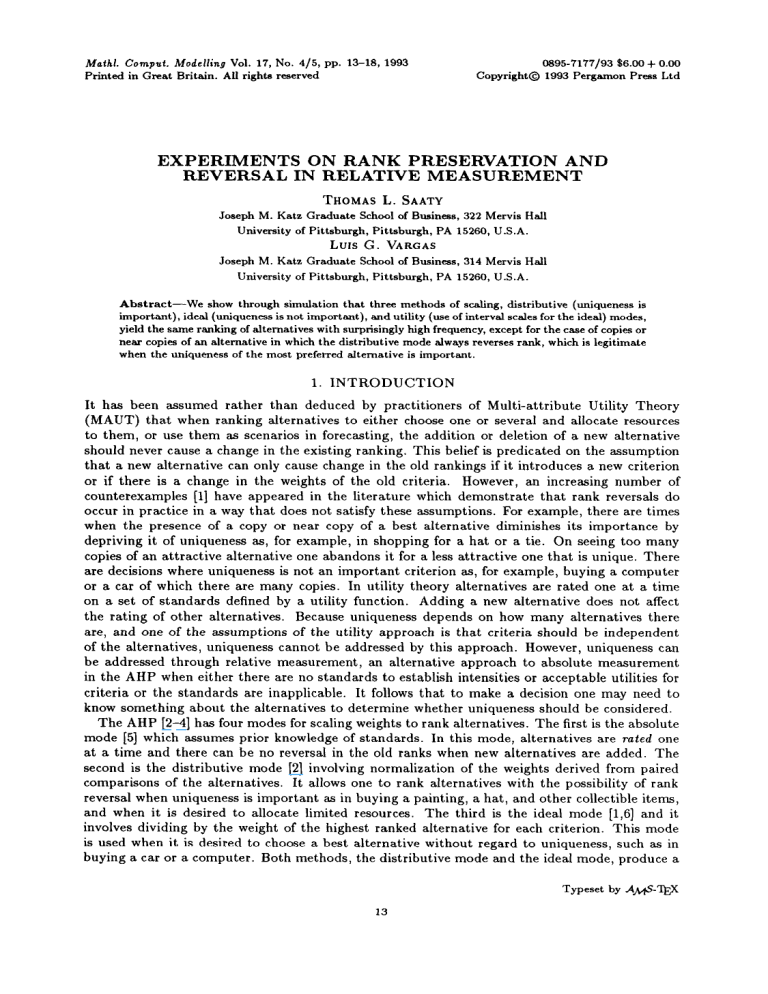
show through simulation that three methods of scaling, distributive (uniqueness is
important), ideal (uniqueness is not important), and utility (use of interval scales for the ideal) modes,
yield the same ranking of alternatives with surprisinglyhigh frequency, except for the case of copies or
near copies of an alternative in which the distributive mode always reverses rank, which is legitimate
when the uniqueness of the most preferred alternative is important.
1. INTRODUCTION
It has been assumed rather than deduced by practitioners
of Multi-attribute
Utility Theory
(MAUT) that when ranking alternatives
to either choose one or several and allocate resources
to them, or use them as scenarios in forecasting,
the addition or deletion of a new alternative
should never cause a change in the existing ranking. This belief is predicated on the assumption
that a new alternative
can only cause change in the old rankings if it introduces
a new criterion
or if there is a change in the weights of the old criteria.
However, an increasing
number of
counterexamples
[l] have appeared in the literature
which demonstrate
that rank reversals do
occur in practice in a way that does not satisfy these assumptions.
For example, there are times
when the presence of a copy or near copy of a best alternative
diminishes
its importance
by
depriving it of uniqueness
as, for example, in shopping for a hat or a tie. On seeing too many
copies of an attractive
alternative
one abandons it for a less attractive one that is unique. There
are decisions where uniqueness
is not an important
criterion as, for example, buying a computer
or a car of which there are many copies. In utility theory alternatives
are rated one at a time
on a set of standards
defined by a utility function.
Adding a new alternative
does not affect
the rating of other alternatives.
Because uniqueness
depends on how many alternatives
there
are, and one of the assumptions
of the utility approach is that criteria should be independent
of the alternatives,
uniqueness
cannot be addressed by this approach.
However, uniqueness
can
be addressed through relative messurement,
an alternative
approach to absolute measurement
in the AHP when either there are no standards
to establish intensities
or acceptable utilities for
criteria or the standards
are inapplicable.
It follows that to make a decision one may need to
know something
about the alternatives
to determine whether uniqueness
should be considered.
The AHP [2-4] has four modes for scaling weights to rank alternatives.
The first is the absolute
mode [5] which assumes prior knowledge of standards.
In this mode, alternatives
are rated one
at a time and there can be no reversal in the old ranks when new alternatives
are added. The
second is the distributive
mode [2] involving normalization
of the weights derived from paired
comparisons
of the alternatives.
It allows one to rank alternatives
with the possibility
of rank
reversal when uniqueness
is important
as in buying a painting, a hat, and other collectible items,
and when it is desired to allocate limited resources.
The third is the ideal mode [l,S] and it
involves dividing by the weight of the highest ranked alternative
for each criterion.
This mode
is used when it is desired to choose a best alternative
without regard to uniqueness,
such as in
buying a car or a computer.
Both methods, the distributive
mode and the ideal mode, produce a
Typeset by A,# - ‘Y&X
13
14 zyxwvutsrqponmlkjihgfedcbaZYXWVUTSRQPONMLKJIHGFEDCBA
T.L. SAATY, L.G. VARGAS
ranking on a ratio scale. However, in the former, the final weights of the alternatives
depend on
each other both before and after synthesis through weighting and adding. In the latter, adding
a new alternative
necessitates
that it be compared with the highest ranked alternatives
for each
criterion.
Traditionally,
it has been held that it is reasonable to expect a dominating
alternative
on some criterion to cause rank reversal. Unless the new alternative
dominates the highest ranked
one for some criterion, it cannot affect the ranks of the existing alternatives.
When in the ideal
mode the ratio scale measurements
of the alternatives
are transformed
to interval scales it is
known as the utility mode. Some utility theorists believe that under appropriate
interpretation,
such a transformation
would not even cause a dominating
alternative
to effect change in the
ranks of the old alternatives-but
the counterexamples
have clearly shown that such a condition
is too stringent
to be satisfied in practice. The fourth mode, known as the supermatrix
approach
[3, p. 1991, allows one to consider dependencies
between different levels of a feedback network, of
which a decision hierarchy is a particular
case.
We thought to do a large number of random experiments
on a three level hierarchy of criteria
and alternatives
to see how often rank reversals occur. Our findings very strongly support the
observation
that the ideal mode should be used to choose the best alternative
when the presence
of copies and near copies or perturbations
of copies do not matter. But when it does one should
use the distributive
mode. None of our experiments
give any evidence favoring a shift to interval
scales.
Table 1. Number of times that the most preferred alternative remains most preferred.
DISTRIBUTIVE
No. of
Criteria
IDEAL MODE
MODE
No.of
Zriteria
Number of Alternatives
2
3
4
5
6
7
8
9
Number of Alternatives
2
3
4
5
6
7
8
9
992
2
961
957
964
969
973
979
979
979
2
971
965
977
987
985
992
990
3
958
951
955
959
958
970
971
973
3
953
967
973
976
985
987
992
995
4
946
933
931
933
959
965
952
964
4
960
949
957
964
981
977
989
988
5
924
926
940
934
955
941
944
961
5
947
952
964
967
977
981
984
988
6
951
957
955
974
979
973
979
985
6
929
922
928
941
942
943
959
962
7
921
938
927
917
924
958
953
957
7
936
947
955
968
953
974
974
983
8
926
920
931
934
945
949
957
943
8
945
942
953
957
971
985
979
987
9
915
916
926
927
933
936
945
948
9
939
929
963
966
964
985
977
980
UTILITY
N o. of
Criteria
MODE zyxwvutsrqponmlkjihgfedcbaZYXWVUTSRQPONM
Number of Alternatives
I
2
3
4
5
6
7
8
9
910
935
954
963
981
987
977
988
881
907
936
945
963
976
981
989
866
907
925
943
956
964
973
971
851
901
919
939
953
950
965
966
856
878
901
923
940
959
957
961
860
901
903
919
935
963
961
971
870
877
897
925
924
957
955
971
867
872
920
917
939
948
944
964
2. EXPERIMENTAL
DESIGN
AND
RESULTS
In this note, we experimentally
study the impact that the addition of a new alternative
in a
hierarchy has on the final ranking of the alternatives.
We have assumed without loss of generality
that the hierarchies have three levels: the goal, criteria, and alternatives.
The number of criteria
and the number of alternatives
vary from 2 to 9. Thus, the total number of different hierarchies
in our experiment
is equal to 64.
15 zyxwvutsrqpo
Ftank preservation
Table 2. Itank preservation of the hrst and second most preferred alternatives.
DISTRIBUTIVE
No. of
%iteria
IDEAL MODE
MODE
N o. of
Criteria
Number of Alternatives
2
3
4
5
6
7
8
9
964
967
953
965
973
981
984
980
985
921
956
942
949
962
966
962
St%
987
913
957
934
933
935
960
956
966
971
914
SO4
948
913
939
936
944
951
966
968
895
887
896
941
918
908
923
945
958
962
960
871
867
906
878
926
901
910
933
949
940
949
963
872
841
882
896
933
903
924
916
939
940
950
957
867
928 896 898 906 913 932 949 957
882 zyxwvutsrqponmlkjihgfedcbaZYXWVUTSRQPONMLKJIHGF
2
3
4
5
6
7
8
959
935
933
936
936
955
929
939
910
899
901
SO8
905
SO3
944
893
874
878
889
900
915
938
858
879
862
873
869
921
876
863
866
869
910
862
847
852
925
868
849
817
919
844
841
852
828
Number of Alternatives
874
9
UTILITY MODE
Number of Alternatives
N o. of
Criteria
2
3
4
5
6
7
8
9
877
887
904
949
961
955
960
971
852
827
873
888
915
933
937
964
877
808
843
869
912
914
932
939
873
778
830
855
885
SO6
923
931
858
810
831
839
878
903
913
917
851
808
812
863
881
885
917
920
850
788
797
854
863
881
910
929
832
770
807
829
841
887
902
908
Table 3. Rank preservation of all alteratives.
DISTRIBUTIVE
No. of
Xteria
IDEAL MODE
MODE
No. of
Number of Alternatives
Number of Alternatives zyxwvutsrqponmlkjihgfedcbaZYXWVUTSRQPONMLKJIHGFED
Criteria
7
8
9
6
7
8
9
2
3
4
5
6
4
5
2
3
963
935
896
866
844
828
802
763
2
967
959
944
948
941
949
938
949
941
873
862
838
766
725
706
687
3
951
932
922
926
906
914
913
925
708
665
614
4
955
915
893
888
890
886
908
881
939
882
843
798
728
922
880
827
765
699
675
623
593
5
942
910
902
889
892
870
869
874
928
848
801
756
683
641
630
574
6
955
896
883
871
859
874
866
850
932
847
800
744
691
652
603
552
7
953
916
880
862
866
853
842
842
940
841
792
743
672
650
567
523
8
951
904
870
872
846
857
832
845
908
854
794
728
655
609
548
526
9
937
SO3
866
836
831
827
838
832
UTILITY MODE
No. of
Criteria
Number of Alternatives
I
zyxwvutsrqponmlkjihgfedcbaZYXW
2
3
4
5
6
7
8
9
903
887
896
874
883
884
868
903
854
805
814
833
811
827
816
815
880
815
801
788
796
800
792
789
873
812
764
750
760
769
734
768
842
815
756
771
720
721
739
751
857
804
748
718
720
730
711
726
860
791
757
718
713
716
689
701
858
798
722
704
695
702
692
664
16
T.L.
zyxwvutsrqponmlkjihgfedcbaZYXWVUTSRQPONMLKJIHGFEDCBA
SAATY, zyxwvutsrqponmlkjihgfedcbaZYXWVUTSRQPONML
L.G. VARGAS
Table 4. Rank preservation of the most preferred alternative.
DISTRIBUTIVE
MODE vs. IDEAL MODE
BEFORE AN ALTERNATIVE
No. of
Cri t&a
DISTRIBUTIVE
No. of
Zriteria
Number of Alternatives
2
3
4
5
6
7
MODE vs. IDEAL MODE
AFTER AN ALTERNATIVE
IS ADDED
8
9
IS ADDED
Number of Alternatives
zyxwvutsrqponmlkjihgfedcbaZYXWVUTSRQPONMLKJIHGF
2
3
4
5
6
7
8
9
2
983
973
954
936
942
961
957
950
2
970
966
953
940
957
958
954
954
3
974
942
932
929
922
942
929
924
3
944
936
934
929
921
937
928
925
4
960
946
918
923
919
929
927
913
4
925
924
909
912
932
922
920
920
5
967
935
929
898
907
908
897
919
5
939
928
913
904
901
899
891
912
6
955
946
915
889
903
910
891
905
6
924
904
900
895
890
907
895
905
7
956
921
915
882
883
881
878
898
7
922
902
904
888
888
890
878
901
8
947
912
899
877
883
890
871
881
8
917
897
906
892
896
885
872
883
9
970
941
896
882
887
885
883
891
9
911
911
888
880
892
886
871
896
DISTRIBUTIVE
MODE vs. UTILITY
BEFORE AN ALTERNATIVE
MODE
DISTRIBUTIVE
IS ADDED
No. of
Criteria
Number of Alternatives
N o. of
Criteria
2
3
4
5
6
7
8
MODE vs. UTlLITY
AFTER AN ALTERNATIVE
9
MODE
IS ADDED
zyxwvutsrqponmlk
Number of Alternatives
2
3
4
5
6
7
8
9
934
2
842
893
898
890
914
927
937
930
2
878
902
894
906
930
929
938
3
854
824
854
857
874
898
890
889
3
861
859
866
873
874
906
897
896
4
819
812
846
833
855
881
884
872
4
790
821
829
847
872
858
884
892
877
5
808
822
837
820
847
845
856
877
5
805
838
834
842
845
844
857
6
810
793
818
798
837
847
845
852
6
803
796
834
811
819
869
857
866
7
810
795
821
798
809
840
821
852
7
783
801
820
813
826
838
834
856
8
785
793
808
803
820
831
814
827
8
784
791
826
831
829
830
828
834
9
820
818
793
801
813
824
824
826
9
780
804
810
806
834
836
824
851
IDEAL MODE vs. UTILITY
BEFORE AN ALTERNATIVE
No. of
Zriteria
MODE
IDEAL
IS ADDED
Number of Alternatives
2
3
4
MODE
AFTER
6
7
8
9
MODE
IS ADDED
Number of Alternatives
N o. of
5
vs. UTILITY
AN ALTERNATIVE
/Criteria
2
3
4
5
6
7
8
9
2
859
919
937
944
960
961
971
975
2
901
932
937
949
967
967
976
973
3
872
874
917
907
929
942
951
944
3
903
912
920
926
942
954
958
950
4
853
865
903
894
916
924
939
945
4
855
887
908
914
928
915
949
950
5
837
870
893
888
916
923
932
942
5
858
892
904
912
928
924
946
945
6
845
838
881
888
916
923
932
942
6
865
870
909
897
913
952
930
929
7
836
853
877
887
893
928
912
931
7
848
874
893
906
912
931
930
926
8
832
860
875
894
910
926
916
918
8
841
867
899
917
908
918
936
928
9
844
861
864
885
901
919
924
914
9
856
873
889
905
904
919
932
930
For each hierarchy,
we generated,
at random,
goal, and the weights of the alternatives
were uniform
transformed
mode.
(0,l)
Let cj, j=
with respect
alternatives
variates.
according
The
weights
to three methods:
1,2 ,...,
to criterion
with respect
the weights of the criteria
with respect
to each criterion.
of the alternatives
the distributive
m be the weights of the criteria,
with respect
mode,
with respect
These
random
to the
weights
to the criteria
the ideal mode,
were
and the utility
let wij be the weight of alternative
j, and let ~J~zI wij = 1. For the distributive
mode,
zyxwvutsrqp
i
the weight of the
to the goal is given by:
m
Wi
Z
zyxwvutsrqponmlkjihgfedcbaZYXWVUTSRQPONMLKJIHG
c
j=l
Wij Cj
.
Flank preservation
17
zyxwvutsrqponmlkjihgfedcbaZYXWVUTSRQPONMLKJIH
Table 5. Rank preservation of the two most preferred alternatives.
DISTRIBUTIVE
BEFORE
N o. of
(hiteria
MODE
vs. IDEAL
AN ALTERNATIVE
Number
2
3
4
DISTRIBUTIVE
MODE
AFTER
IS ADDED
No. of
Zriteria
of Alternatives
5
6
7
8
MODE
vs. IDEAL
AN ALTERNATIVE
MODE
IS ADDED
Number of Alternatives
2
3
4
5
6
7
8
9
9
zyxwvutsrqponmlkjihgfedcbaZYXWVUTSRQPONMLKJIHGFEDCB
938 899 883 882 874 867 905 885
zyxwvutsrqponmlkjihgfedcbaZYXWVUTSRQPONMLKJIHGFEDCBA
2
880
2
982
927
892
881
882
878
901
3
969
904
882
836
841
822
839
827
3
893
889
855
829
841
820
836
829
4
959
890
840
815
805
798
779
776
4
882
846
810
767
796
796
801
785
5
959
892
841
781
766
756
760
762
5
863
828
794
789
777
768
753
756
6
968
866
832
798
754
742
741
739
6
865
820
790
770
762
757
735
736
7
951
849
814
781
747
762
746
755
7
862
807
785
763
752
743
736
735
8
954
861
794
762
761
734
723
749
8
878
816
764
755
752
727
736
732
9
966
844
787
774
733
736
745
726
9
852
807
750
758
731
708
734
724
DISTRIBUTIVE
BEFORE
MODE
vs. UTILITY
AN ALTERNATIVE
No. of
Zriteria
Number
2
3
DISTRIBUTIVE
MODE
AFTER
IS ADDED
of Alternatives
MODE
5
6
7
8
9
MODE
IS ADDED
Number of Alternatives
No. of
Criteria
4
vs. UTILITY
AN ALTERNATIVE
2
3
4
5
6
7
8
9
848
2
867
789
770
796
805
813
844
833
2
788
815
774
809
806
814
853
3
833
727
695
718
719
744
762
771
3
709
717
710
727
742
749
775
770
4
814
782
675
667
696
681
699
698
4
693
680
683
656
693
687
733
699
5
808
648
653
652
648
649
632
686
5
672
643
656
670
666
654
654
680
6
807
671
656
635
640
623
639
648
6
661
629
627
626
636
629
627
660
7
829
647
641
615
606
613
656
661
7
614
616
617
620
632
638
665
8
789
669
594
608
627
615
618
658
8
643
611
585
628
639
631
628
642
9
813
645
602
633
593
600
631
646
9
650
614
601
634
613
596
630
647
IDEAL
BEFORE
MODE
vs. UTILITY
MODE
AN ALTERNATIVE
IDEAL
AFTER
IS ADDED
MODE
vs. UTILITY
AN ALTERNATIVE
Number
Number of Alternatives
of Alternatives
5
6
7
8
9
2
3
4
5
844
876
889
881
920
914
835
879
866
782
821
816
869
875
889
793
802
810
773
779
775
828
819
862
850
783
767
835
721
748
794
800
795
806
832
754
827
747
753
779
808
784
823
827
864
746
753
749
747
768
821
819
743
714
736
775
791
837
741
737
772
765
785
2
3
4
885
850
858
792
849
For the ideal mode,
MODE
IS ADDED
6
7
8
9
895
893
904
923
934
824
851
872
891
890
807
796
830
846
872
856
751
785
818
824
815
836
841
743
735
773
773
804
800
828
034
827
743
740
757
773
759
780
821
849
799
815
706
721
740
769
796
803
818
831
883
815
zyxwvutsrqponmlkjihgfedcbaZYXWVUTSRQPONMLKJ
717 739 738 788 782 793 833 837
we have:
viE jt;
(m$ywjj~
> 5.
And for the utility mode we have: zyxwvutsrqponmlkjihgfedcbaZYXWVUTSRQPONMLKJIHGFEDC
Wij
Ui
-
lllinj
3
{Wij}
Cj.
Kltij
{Wij}
-
zyxwvutsrqponmlkjihgfedcbaZYXWVUTSRQPONMLKJ
Iklj
{Wij}
>
A new alternative was then introduced and assigned a random weight also from a uniform (0,l)
variable for each criterion. This random variate was then added to the set of random variates
T.L. zyxwvutsrqponmlkjihgfedcbaZYXWVUTSRQPONMLKJIHGFEDCBA
SAATY. L.G. VARCAS
18
under each criterion and the three transformations
mentioned
above were applied to obtain the
new weights of the alternatives
with respect to the goal. The old ranking of the alternatives
is
now compared with the new ranking.
We performed three distinct sets of simulations
(sample size of 1000). First, we estimated the
frequency with which the distributive,
the ideal, and the utility methods preserve the rank of the
most preferred alternative
when a new alternative
is added (see Table 1). Second, we estimated
the frequency with which the ranking of the two most preferred alternatives
is preserved after the
addition of a new alternative
(see Table 2); and third, we estimated
the frequency of any rank
reversal when a new alternative
is added to the set (see Table 3).
In addition, we compared the three methods in pairs. In Table 4 we give the results of estimating
the frequency with which the distributive,
the ideal, and the utility methods yield the same most
preferred alternative
before and after a new alternative
is added. In Table 5 we give the results
of comparing
the methods in pairs, but estimated
the frequency with which two methods yield
the same two most preferred alternatives
before and after a new alternative
is introduced.
We
also simulated
the addition of copies and near copies (10 percent deviation
on either side of a
weight).
3. CONCLUSIONS
The results of the simulation
show that all three methods yield the same answer with surprisingly high frequency, except for the addition of copies or near copies for which the distributive
mode always reversed rank as expected.
Our conclusion is that to choose a zyxwvutsrqponmlkjihgfedcbaZY
best alternative
if a
new alternative
is added to the set of alternatives
and the alternative
is a copy or a near copy of
an existing one, then one should use the distributive
mode if the uniqueness of the choice is important; otherwise, one should use the ideal mode. In case of resource allocation and interdependent
scenarios to predict the future, the distributive
mode is needed because all the alternatives
play
a role in the final outcome.
REFERENCES
1.
2.
3.
4.
5.
6.
T.L. Saaty, Resolution of the rank preservation-reversal issue, Working Paper, University of Pittsburgh,
(1992).
T.L. Saaty, Scaling method for priorities in hierarchical structures, Journal of Math. Psych. 15, 234-281
(1977).
T.L. Saaty, zyxwvutsrqponmlkjihgfedcbaZYXWVUTSRQPONMLKJIHGFEDCBA
M ulticriteria Decision
Making: The Analytic Hierarchy Process, Original version published by
McGraw-Hill, 1980, RWS Pub., Pittsburgh, (1990).
T.L. Saaty, Axiomatic foundation of the analytic hierarchy process, Management
Science 32, 841-855
(1986).
T.L. Saaty, Rank generation, preservation and reversal in the analytic hierarchy decision process, Decision
Sciencea 18, 157-177 (1987).
E.H. Forman, Rank adjustment and rank reversal-And how to evaluate thousands of alternatives with
AHP, Working Paper, George Washington University, (1992).

