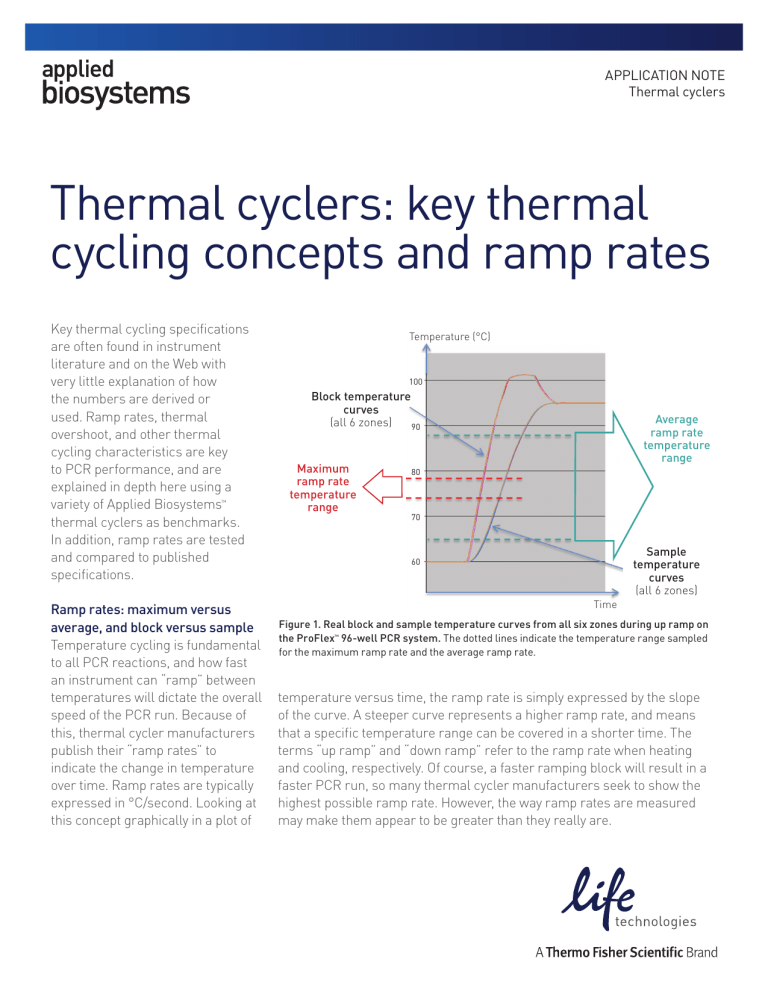
APPLICATION NOTE Thermal cyclers Thermal cyclers: key thermal cycling concepts and ramp rates Key thermal cycling specifications are often found in instrument literature and on the Web with very little explanation of how the numbers are derived or used. Ramp rates, thermal overshoot, and other thermal cycling characteristics are key to PCR performance, and are explained in depth here using a variety of Applied Biosystems™ thermal cyclers as benchmarks. In addition, ramp rates are tested and compared to published specifications. Ramp rates: maximum versus average, and block versus sample Temperature cycling is fundamental to all PCR reactions, and how fast an instrument can “ramp” between temperatures will dictate the overall speed of the PCR run. Because of this, thermal cycler manufacturers publish their “ramp rates” to indicate the change in temperature over time. Ramp rates are typically expressed in °C/second. Looking at this concept graphically in a plot of Temperature (°C) 100 Block temperature curves (all 6 zones) 90 Maximum ramp rate temperature range Average ramp rate temperature range 80 70 Sample temperature curves (all 6 zones) 60 Time Figure 1. Real block and sample temperature curves from all six zones during up ramp on the ProFlex™ 96-well PCR system. The dotted lines indicate the temperature range sampled for the maximum ramp rate and the average ramp rate. temperature versus time, the ramp rate is simply expressed by the slope of the curve. A steeper curve represents a higher ramp rate, and means that a specific temperature range can be covered in a shorter time. The terms “up ramp” and “down ramp” refer to the ramp rate when heating and cooling, respectively. Of course, a faster ramping block will result in a faster PCR run, so many thermal cycler manufacturers seek to show the highest possible ramp rate. However, the way ramp rates are measured may make them appear to be greater than they really are. The metal blocks of thermal cyclers must be heated and cooled between steps in PCR, such as denaturation, annealing, and extension. A commonly published specification is the maximum block ramp rate, also known as the peak block ramp rate. The maximum block ramp rate corresponds to the highest achievable block performance. This maximum performance may only be achieved during a very brief period during the ramp. Thermal cycler manufacturers may also publish the average block ramp rate, which represents the rate of temperature change across a longer portion of the ramp, providing a more representative measurement of the instrument’s performance and speed (Figure 1). However, just because the block is ramping quickly does not mean that the liquid of your PCR reaction (sample) is ramping just as quickly. It takes time for the heat from the thermal cycler’s block to be transferred to the sample. Because of this, Applied Biosystems ramp rates are expressed in terms of average sample ramp rate or maximum sample ramp rate. Ramp rates that are based on the block temperature alone, without accounting for sample volume, do not reflect the ramp rate experienced by the sample. Applied Biosystems instruments use a proprietary algorithm that calculates the temperature of the PCR sample itself, based on the volume entered. This allows us to publish sample ramp rates. We also publish block ramp rates to allow a more direct comparison to other manufacturers’ instruments. Overview: sample temperature control How thermal cyclers achieve and measure temperature differs, depending on the manufacturer. Often, thermal cyclers are programmed to achieve temperatures based on block temperature alone, without accounting for the temperature of the liquid sample. However, just because the block has achieved its desired temperature, or “set point”, does not mean that the sample has achieved the same set point. The proprietary temperature control algorithm used by Applied Biosystems instruments helps ensure that temperature set points are reached quickly and accurately, by accounting for the sample volume used. This algorithm actually drives the block temperature higher than the set point to permit the sample to reach the set point faster. This is known as the "block overshoot thermal energy", depicted in green in Figure 2. It is important to note that although the block overshoots the set point, the sample should arrive at the set point with no overshoot. In addition, the instrument does not begin to count down the time of that step until the sample reaches the set point. This helps ensure that the sample spends exactly the amount of time at a specific temperature that you programmed into the instrument. Temperature (ºC) Temperature set point Block overshoot thermal energy (green area) generated to be transferred to sample. Block temperature (sample-driven algorithm) Sample temperature Time (sec) Figure 2. Block overshoot thermal energy. The reaction block (blue) and sample (red) temperature curves and associated block overshoot thermal energy (green) during a heating phase that is ideally controlled. The horizontal dotted line indicates the set temperature for this phase. Our proprietary temperature control algorithm helps ensure samples reach a stable set point temperature— within a range of ±0.25˚C—without overshoot and associated deleterious effects. The algorithm uniquely predicts the temperature and speed of the PCR reaction while accounting for the volume of the PCR reaction and the thickness of the reaction tube. Sample temperature or sample ramp rates are typically not mentioned by other instrument manufacturers. Published versus measured ramp rates Our ProFlex™, Veriti™, and SimpliAmp™ thermal cyclers include both the maximum block ramp rate and the more relevant maximum sample ramp rate. The published data [1–3] are based on the averages of measured performance data captured during product testing (Table 1). Some manufacturers’ published thermal cycler ramp rates are known to vary significantly from actual measured ramp rates [4]. In a recent comparison of maximum block ramp rates of multiple thermal cyclers, the smallest differences between the published and measured ramp rates were observed for Applied Biosystems thermal cyclers (Table 2). These differences are useful when directly comparing instruments’ capabilities. Table 1. Measured and published data for Applied Biosystems ProFlex, Veriti, and SimpliAmp thermal cyclers. Applied Biosystems thermal cycler Measured data Max block rate (°C/sec) Block type Max sample rate at 1 µL (°C/sec)* Up ramp Down ramp Up ramp Down ramp ProFlex 96-well 6.4 5.9 4.6 4.3 ProFlex 3 x 32-well 6.2 5.6 4.4 4.2 SimpliAmp 96-well 4.0 3.7 3.1 3.0 Veriti 96-well Fast 4.9 5.1 4.3 3.6 Veriti 96-well 3.8 3.9 3.4 2.8 Published data (average of above) ProFlex 96-well 6.0 4.4 ProFlex 3 x 32-well 6.0 4.4 SimpliAmp 96-well 4.0 3.0 Veriti 96-well Fast 5.0 4.2 Veriti 96-well 3.9 3.4 *Per industry standard practice, a reaction volume of 1 µL is used to show the highest achievable sample ramp rate. Table 2. Comparison of average maximum block ramp rates (°C/sec) of thermal cyclers from different manufacturers [4]. ProFlex 96-well Thermal Cycler ProFlex 3 x 32-well Thermal Cycler Eppendorf Mastercycler™ Pro S Thermal Cycler Bio-Rad C1000 Touch™ Thermal Cycler Published Published Published Published Measured Measured Measured Measured Up Down Up Down Up Down Up Down Up Down Up Down Up Down Up Down 6.0 6.0 6.4 5.9 6.0 6.0 6.2 5.6 6.0 4.5 5.4 3.9 5.0 5.0 3.0 2.4 SimpliAmp 96-well Thermal Cycler Bio-Rad T100™ Thermal Cycler Bio-Rad MyCycler™ Thermal Cycler Bioer XP Cycler Published Published Published Published Measured Measured Measured Measured Up Down Up Down Up Down Up Down Up Down Up Down Up Down Up Down 4.0 4.0 4.0 3.7 4.0 4.0 2.6 1.6 2.5 1.5 2.6 1.6 5.0 3.0 2.6 1.8 Takara Dice™ Touch Thermal Cycler Eppendorf Mastercycler Nexus Thermal Cycler SensoQuest Labcycler Bioer GeneMax Published Published Published Published Measured Measured Measured Measured Up Down Up Down Up Down Up Down Up Down Up Down Up Down Up Down 3.0 2.5 3.6 2.9 3.0 2.0 3.3 1.9 4.2 3.6 3.7 3.2 5.0 4.0 4.6 3.5 Summary Precise temperature control by a thermal cycler is crucial for the accuracy and efficiency of PCR experiments. Multiple instrument-specific factors, including the actual instrument ramp rates, sample temperatures, and how the thermal cycler ensures accurate overshoot calculation, contribute to the integrity and performance of PCR assays. Our proprietary algorithm uniquely enables our thermal cyclers to achieve the correct temperatures of the samples, rather than the blocks; the resulting published ramp rates help ensure adherence to the programmed protocol, and evaluation of an instrument’s true performance. References 1. ProFlex PCR System User Guide. P/N MAN0007697, Rev 2.0. 2. Veriti Thermal Cycler User Guide. P/N 4375799, Rev. E 3. SimpliAmp Thermal Cycler User Guide. P/N MAN0009889, Rev. A 4. Kim YH, Yang I, Bae YS, Park SR (2008) Performance evaluation of thermal cyclers for PCR in a rapid cycling condition. Biotechniques 44(4):495–505. Find out more at lifetechnologies.com/thermalcyclers For Research Use Only. Not for use in diagnostic procedures. © 2015 Thermo Fisher Scientific Inc. All rights reserved. All trademarks are the property of Thermo Fisher Scientific and its subsidiaries unless otherwise specified. Bio-Rad, C1000 Touch, MyCycler, and T100 are trademarks of Bio-Rad Laboratories, Inc. Eppendorf and Mastercycler are trademarks of Eppendorf AG. Takara and Dice are trademarks of Takara Holdings, Inc. CO29812 0415
