ejercicios resueltos de <SIL> Safety Integrity Level. Seguridad de procesos.
Anuncio
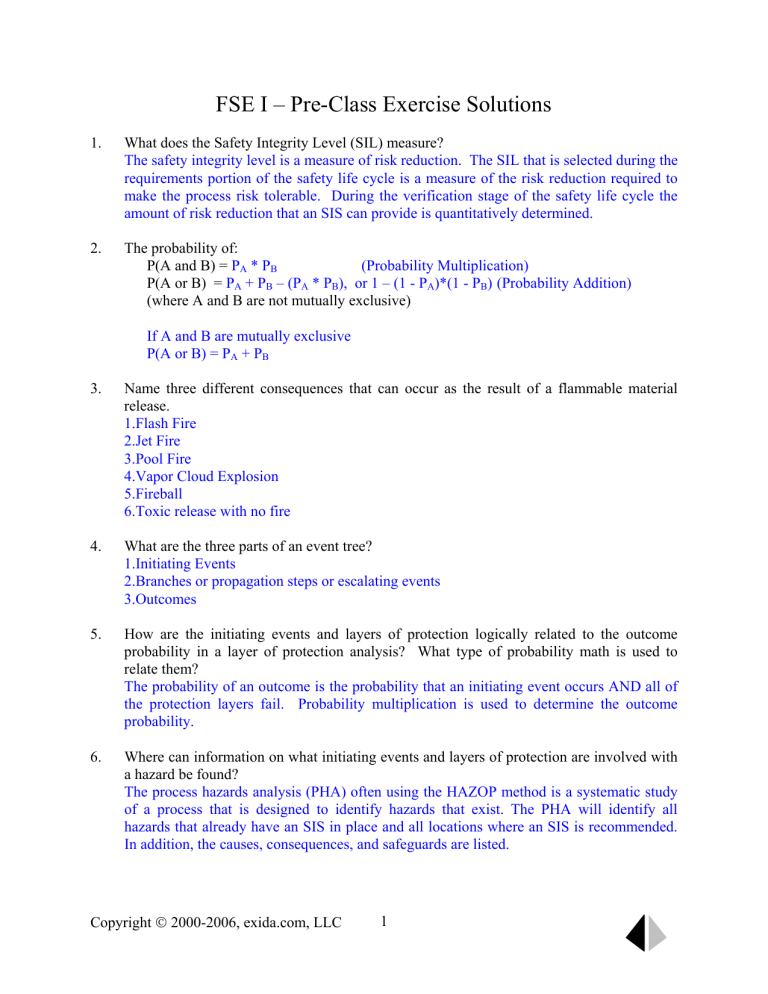
FSE I – Pre-Class Exercise Solutions 1. What does the Safety Integrity Level (SIL) measure? The safety integrity level is a measure of risk reduction. The SIL that is selected during the requirements portion of the safety life cycle is a measure of the risk reduction required to make the process risk tolerable. During the verification stage of the safety life cycle the amount of risk reduction that an SIS can provide is quantitatively determined. 2. The probability of: (Probability Multiplication) P(A and B) = PA * PB P(A or B) = PA + PB – (PA * PB), or 1 – (1 - PA)*(1 - PB) (Probability Addition) (where A and B are not mutually exclusive) If A and B are mutually exclusive P(A or B) = PA + PB 3. Name three different consequences that can occur as the result of a flammable material release. 1.Flash Fire 2.Jet Fire 3.Pool Fire 4.Vapor Cloud Explosion 5.Fireball 6.Toxic release with no fire 4. What are the three parts of an event tree? 1.Initiating Events 2.Branches or propagation steps or escalating events 3.Outcomes 5. How are the initiating events and layers of protection logically related to the outcome probability in a layer of protection analysis? What type of probability math is used to relate them? The probability of an outcome is the probability that an initiating event occurs AND all of the protection layers fail. Probability multiplication is used to determine the outcome probability. 6. Where can information on what initiating events and layers of protection are involved with a hazard be found? The process hazards analysis (PHA) often using the HAZOP method is a systematic study of a process that is designed to identify hazards that exist. The PHA will identify all hazards that already have an SIS in place and all locations where an SIS is recommended. In addition, the causes, consequences, and safeguards are listed. Copyright © 2000-2006, exida.com, LLC 1 7. What measure is used in LOPA to demonstrate the effectiveness of a safeguard, and how is it calculated? The effectiveness of safeguards is demonstrated as Probability of Failure on Demand (PFDavg). PFDavg is a function of an items failure (λ) and test interval (TI). These quantities are related by the following equation: PFDavg = (λ * t) / 2 8. Name two methods that can be used to assign SIL given that a consequence and likelihood have been determined. Risk Matrix Risk Graph Frequency Based Target Individual Risk Based Target 9. What standards are available to assist in design of burner management systems in your plant’s location? NFPA 85 and NFPA 86 in the US AS 3814 / AG 501 and AS 1375 in Australia Copyright © 2000-2006, exida.com, LLC 2 FSE I - Application Exercise 1 Title: 1. Tolerable Risk Develop a tolerable risk guideline and risk matrix for environmental risks ranging from 1 per 10 years to 1 per 100,000 year events and ranging from release inside the plant with small consequences up to a release outside the plant with large permanent consequences? Assume all extreme risks will be reduced and all moderate risks will be reduced where practical. 1/10 yrs 1/100 yrs 1/1000 yrs 1/10,000 yrs 1/100,000 yrs 2. Internal release with small consequences Internal release with large consequences or External release with small temporary consequences External release with large temporary or small permanent consequences External release with large permanent consequences Moderate Moderate Extreme Extreme Acceptable Moderate Moderate Extreme Acceptable Moderate Moderate Moderate Acceptable Acceptable Moderate Moderate Acceptable Acceptable Acceptable Moderate Compare your tolerance with that of the example matrix in the slides and identify the equality points. (Where does the tolerable frequency match for different consequences?) In the proposed answer, Recordable injury roughly matches internal release with small consequences. Lost time injury roughly matches internal release with large consequences or external release with small temporary consequences. Permanent injury roughly matches external release with large temporary or small permanent consequences. Many deaths roughly matches external release with large permanent consequences. 3. Are there any significant points where the risk tolerance is inconsistent? For example does the tolerance for external releases with large temporary consequences match that for many human fatalities? In the proposed answer, most items are generally consistent depending on the view of one death vs external release with small permanent consequences. Better definition on the large and small consequences is probably needed to make this a more useful working guide. Note that with the same number of categories and the same risk tolerances, the matrix can be combined with the one from the slides relatively easily by incorporating a definitions table for the four different consequence magnitudes. Copyright © 2000-2006, exida.com, LLC 3 FSE I - Application Exercise 2 Title: 1. Probability An insurance company studied 32400 persons for six months. There were 1800 accidents. If this dangerous condition is equally likely at any moment, what is the probability of the dangerous condition in any given year? The probability of an event is the number of outcomes divided by the number of chances. In this problem there is one outcome (i.e., accident) and nine chances (i.e., nine years). So, P= 2. outcomes 1800accidents 1 = = = 0.11 chances 16200 person _ years 9 We toss three fair coins. What is the probability of getting three heads? The probability of getting three heads is the ANDing of the probabilities of getting a head on each of three individual tosses. For each individual toss the probability of heads is ½. P1 = P2 = P3 = 0.5 Poverall = P1 * P2 * P3 = 0.5 * 0.5 * 0.5 = 0.125 3. A system will fail if a power supply fails or a controller fails. The probability of a power supply failure during the next year is 0.05. The probability of a controller failure in the next year is 0.01. What is the probability of system failure? The probability of system failure is given if the power supply OR the controller fails. The events are logically OR’d so use probability addition. Also, the events are not mutually exclusive (i.e., both the sight glass and transmitter can fail at the same time), so use the form: P (A or B) = PA + PB – PA * PB Psystem failure = 0.05 + 0.01 – 0.05 * 0.01 = 0.0595 4. A check valve has a probability of not stopping reverse flow of 0.015 in a one-year interval. The probability of getting a dangerous condition in the next year is 0.004. What is the probability of dangerous condition AND not having the check valve operate? The occurrence of the described situation is the logical ANDing of two probabilities. Use probability multiplication. Poverall = 0.015 * 0.004 = 0.00006 Copyright © 2000-2006, exida.com, LLC 4 FSE I - Application Exercise 3 1. A fault tree is shown below. What is outcome frequency? Freq. = 10 / year Fa Pb P = 0.05 AND Pc P = 0.1 Outcome Frequency = Fa * Pb * Pc = 10 * 0.05 * 0.1 = 0.05 /year 2. A fault tree is shown below. What is the output probability? P = 0.001 P = 0.002 P = 0.005 Pa Pb OR Pc Probability = 0.001 + 0.002 + 0.005 – 0.001*0.002 – 0.001*0.005 – 0.002*0.005 + 0.001*0.002*0.005 = 0.007983 OR Approx. Probability = 0.001 + 0.002 + 0.005 = 0.008 Copyright © 2000-2006, exida.com, LLC 5 3. A fault tree is shown below. What is the output probability? P = 0.004 P = 0.010 P = 0.006 Pa Pb OR P = 0.01988 Pc AND P = 0.000159 P = 0.080 AND P = 0.008 P = 0.100 P for the top OR gate = 1 – (1 – 0.004)*(1 – 0.010)*(1 – 0.006) = 0.01988 or Approximate P for the top OR gate = 0.004 + 0.010 + 0.006 = 0.020 P for the bottom AND gate = 0.080*0.100 = 0.008 Total Probabilty = 0.01988*0.008 = 0.000159 Approximate Total Probabilty = 0.020*0.008 = 0.00016 Copyright © 2000-2006, exida.com, LLC 6 FSE I - Application Exercise 4 Title: 1. Consequence Analysis Overview Your company is estimating the risk posed by the failure of a new railroad track switching system. Estimate the average consequence, in terms of injuries and fatalities, of a train accident using the following data. In 1996, 550 Fatalities 10,948 Injuries 2,443 Accidents Data from Transportation Statistics Annual Report 1998, Bureau of Transportation Statistics, US Department of Transportation, BTS98-S-01. The average consequence is calculated by dividing the total consequence by the number of opportunities. Average Consequence = (# consequences) / (# opportunities) Average Fatalities = 550 / 2,443 = 0.225 Average Injuries = 10,948 / 2,443 = 4.48 2. Explain why average industry loss data may not be a valid way to estimate the consequence for chemical accidents? For industry average data to be valid two conditions must be satisfied. 1) There must be a large amount of incidents from which to draw data. 2) Each of the incidents must occur under roughly similar circumstances. Neither of these two conditions are true for chemical accidents. Luckily, the amount of chemical accidents is fairly small. Additionally, all chemical plants are very different. It is very unlikely that potential consequences of different plants will be similar enough to allow statistical analysis. 3. A high-pressure vessel containing flammable gas that is liquefied under pressure undergoes an incident where it is expected to instantaneously rupture. What type of incident outcome can be expected if there is a source of ignition? If there is no source of ignition? If there is a source of ignition, a fireball will occur. If there is no source of ignition, possible consequences include equipment damage and other economic losses. Copyright © 2000-2006, exida.com, LLC 7 FSE I - Application Exercise 5 Title: Event Tree Analysis PROCEDURE: 1. Draw an event tree that describes that following situation: (Use the back of this sheet) • • • A toxic release can be initiated by a delivery driver pumping more material into a storage tank than the available capacity. The delivery driver may or may not realize there is not enough capacity for the material that he is delivering, and then not attempt to transfer the material. The driver may carefully monitor the level in the storage tank and stop the material transfer before a release occurs. INITIATING EVENT More m aterial than available space BRANCH 1 Driver does not notice lack of available Space BRANCH 2 Driver does not detect high level in tank after starting pum p OUTCOME TRUE Spill FALSE No Event TRUE FALSE Copyright © 2000-2006, exida.com, LLC No Event 8 2. Using the following data, quantify the frequency at which toxic releases occur. • • • Based on historical data, delivery drivers are requested to deliver to storage tanks that do not have the required capacity approximately 3 times per year. Due to a training initiative educating the drivers on the hazards of overfilling the tank the probability that the driver will try to fill a tank that does not have sufficient capacity is estimated at 0.01. The probability that the driver will not detect a high level condition after he has begun transfer is estimated at 0.1. INITIATING EVENT More m aterial than available space 3 /year BRANCH 1 Driver does not notice lack of available Space BRANCH 2 Driver does not detect high level in tank after starting pum p TRUE 0.1 FALSE 0.9 TRUE 0.01 FALSE 0.99 Copyright © 2000-2006, exida.com, LLC 9 OUTCOME Spill 0.003 /year No Event 0.027 /year No Event 2.97 /year FSE I - Application Exercise 6 Title: Layer of Protection Analysis PROCEDURE: 1. Draw a LOPA diagram that describes that following situation Reactant A (through manhole) FT 01 FIC 01 To Safe Location PSE 05 UC 01 PSH 04 Reactant B Reaction Inhibitor Cooling Water Supply Drain TSH 07 Product Solution UC 01 PROCESS: A pharmaceutical company has developed a new process to produce one of its drugs. The process creates an aqueous solution that is withdrawn from the bottom of the pressurized, water cooling jacketed, continuously stirred tank reactor. The vessel is charged by filling it with 250 kg of water and manually dumping 125 kg, or 5 bags of reactant A into the vessel. After the vessel is charged and closed, the stirring mechanism is started and the vessel’s jacket is flooded with cooling water. After the stirring and cooling have been established a small metered rate of 0.005 kg/min of reactant B is continuously added to the solution. Reactants A and B combine to form the desired product. Each batch operates for three weeks, and 12 batches are operated per year. Copyright © 2000-2006, exida.com, LLC 10 HAZARDS: The reaction of A and B is nearly instantaneous and highly exothermic. Safe operation of this process requires that an excess amount of reactant B never be allowed into the reactor, and that cooling water continuously be flowing through the jacket. Hazard analysis determined that the following events could cause a “runaway” reaction and physical explosion of the vessel. 1. Failure of controller FIC-01 causing uncontrolled reactant B entry into the reaction vessel. 2. Failure of cooling water supply causing heat and pressure to build up in the vessel. The following layers of protection were identified as a safeguard against explosion of the vessel due to runaway reaction. 1. A rupture disk set to relieve the pressure well below the design pressure of the vessel. 2. Operator intervention to high vessel temperature, high vessel pressure and low cooling water flow alarms. The alarm system is independent from the control system with no common components. It was also noted in the hazard assessment that the rupture disk pressure relief would not be effective in the situation where controller FIC-01 failed, because pressure can not be vented as fast as it is generated. 2. Quantify the LOPA Diagrams The following frequencies and failure probabilities were determined by a process engineer after reviewing the history of the plant. Flow control fails open: Cooling Water Pump Fails: 1/25 /year 1/75 /year Rupture Disk PFD: Operator Response to Cooling Water Loss: Operator Response to Control Failure: 0.0956 0.1 0.1 In this case, use fraction is a layer of protection. An accident can only occur when the hazard is present. 3 weeks/batch * 7 days/week * 12 batches/year = 252 days/year of operation. Use fraction is 252 days / 365 days = 0.69 = 69% Copyright © 2000-2006, exida.com, LLC 11 1. IE #1 INITIATING EVENT FIC-01 Failure PL #1 PL #2 Operator Failure Use Fraction OUTCOME Explosion No Event IE#2 INITIATING EVENT Pump Failure PL #1 PL#2 Operator Failure Rupture Disk Fails Use Fraction OUTCOME Explosion No Event 2. IE #1 INITIATING EVENT FIC-01 Failure PL #1 PL #2 Operator Failure Use Fraction 0.69 OUTCOME Explosion 2.76E-03 0.1 1/25 /yr No Event IE#2 INITIATING EVPL #1 PL#2 Pump Failure Operator Failure Rupture Disk Fails Use Fraction 0.69 0.0956 OUTCOME Explosion 8.80E-05 0.1 1/75 /yr No Event Copyright © 2000-2006, exida.com, LLC 12 FSE I - Application Exercise 7 Title: Quantifying Initiating Events and Layers of Protection PROCEDURE: Use the excerpts from “Guidelines for Process Equipment Reliability Data” to quantify the rates and / or probabilities of the following situations. 1. A motor driven fan fails to provide cooling air, initiating an accident. Use data from “Guidelines for Process Equipment Reliability Data” table 3.3.4, use the mean failure rate. Failure mode of interest is “Fails while running”. 9.09 failures / 106 hours converting to failures per year, 9.09 failures 8760hours * = 0.08 failures / year 106 hours 1year * Initiating events described in frequency 2. A flexible hose ruptures, initiating an accident Use data from “Guidelines for Process Equipment Reliability Data” table 3.2.5, use the mean failure rate. Failure mode of interest is “Rupture”. 0.570 failures / 106 hours converting to failures per year, 0.570 failures 8760hours * = 0.005 failures / year 106 hours 1year Copyright © 2000-2006, exida.com, LLC 13 3. A non-operated check valve, with a periodic inspection and test interval of four years, fails to prevent an accident. Use data from “Guidelines for Process Equipment Reliability Data” table 3.5.1.2, use the mean failure rate. Use catastrophic, which are given per unit time, not failures per attempt. 3.18 failures / 106 hours PFDavg = (λ * t) / 2 PFDavg = (0.00000318 * 4 * 8760) / 2 = 0.055 * Protection layers must be described by a probability. In the case of periodic inspection and test, average probability of failure on demand, which is a function of failure rate and test interval, is the best probability to use. Copyright © 2000-2006, exida.com, LLC 14 FSE I - Application Exercise 8 Title: Assigning Safety Integrity Levels PROCEDURE: An accident can occur that will cause the release of 2,000-pounds of highly toxic phosgene from a reactor that makes polycarbonate resin. Risk analysis has shown that the probable loss of life due to this release is 75.6 fatalities per event. The analysis also showed that the accident has an unmitigated frequency of once per 892 years. Use all four SIL assignment methods described in this section to select safety integrity levels. * Individual risk target for the facility is 1.0 x 10⁻⁴/year. SOLUTIONS: a. Risk Matrix Consequence Æ Extensive Likelihood Æ 1/892 year = 1.2 x 10⁻³ Æ Moderate High Moderate Low 2 1 NR 3b 2 1 3a 3b 3 SIL = 3 Note b: One Level 3 Safety Instrumented Function may not provide sufficient risk reduction at this risk level. Additional review is required (see note d). Note d: This approach is not considered suitable for SIL 4. Copyright © 2000-2006, exida.com, LLC 15 b. Risk Graph Consequence Æ CD Occupancy Æ FB * No credit taken for lack of occupancy this factor is consolidated in the PLL = 75.6 estimate Probability of Avoidance Æ PB * No credit taken for lack of occupancy this factor is consolidated in the PLL = 75.6 estimate Demand Rate Æ W1 Following Risk Graph Path yields SIL = 3 c. Frequency Based Target Select target based on consequence Æ Extensive, 1.0 x 10⁻⁶ RRF = (1/892) / 1.0 x 10-6 = 1121 * Selected SIFRRF must be greater than 1121, so an SIF w/ SIL = 4 d. Individual Risk Target Select target based on consequence Ftarget = 1.0 x 10⁻⁴ / 75.6 = 1.32 x 10⁻⁶ RRF = (1/892) / 1.32 x 10⁻⁶ / = 849 * Selected SIFRRF must be greater than 849, so an SIF w/ SIL = 3 Copyright © 2000-2006, exida.com, LLC 16 FSE I - Application Exercise 9 Title: Comprehensive SIL Selection Exercise PROCEDURE: A chemical processor has just performed an upgrade of a process heater. The upgrade was complex enough for the Management of Change procedures to be used. During the process a new HAZOP was performed on the process section. Review the HAZOP study to determine if there are any new SIS requirements. If so, select a safety integrity level. The process plant’s tolerable risk target is based on the risk integral with a target individual risk of 1.0 x 10⁻⁴. Process Diagram: Vent to Safe Location To Users PSV 02 Vent to Flare PT 07 PIC 07 Wet Gas from Reciprocating Compressor LT 06 Copyright © 2000-2006, exida.com, LLC LIC 06 17 Process Description: A “wet” hydrocarbon gas is compressed by a reciprocating compressor into a flash drum. In the flash drum liquid and vapor separate. The liquid is withdrawn from the bottom of the flash drum under level control and vapor is withdrawn from the top of the vessel and either compressed and sent to downstream users or sent to flare under pressure control. The flare line has not been sized to pass the full discharge of the wet gas compressor to flare. HAZOP Report Output SIF: Consequence: Initiating event: Protection Layers: • • • • • Open vent valve upon high pressure in vessel Overpressure and rupture of vessel Outlet vapor compressor fails Operator intervention Relief Valve Relief valve is pilot operated, tested annually. “Wet gas” compressor is a motor driven reciprocating compressor “Vapor withdrawal” compressor is a motor driven reciprocating compressor Operator is well trained, but only has 15 seconds to perform a shutdown before an accident occurs. Consequence analysis has determined a PLL=0.15 for the overpressure and explosion of the flash drum. SOLUTION Step 1 – The LOPA diagram for the overpressure consequence is as follows. INITIATING EVENT Outlet vapor com pressor fails PL #1 Operator Fails PL #2 Relief valve fails OUTCOME Overpressure No Event Step 2 – Quantify the LOPA diagram. INITIATING EVENT Outlet v apor com pressor fails PL #1 Operator Fails PL #2 Relief v alv e fails 0.00415 OUTCOME Ov erpressure 8.96E-02 1 21.6 /year No Ev ent Copyright © 2000-2006, exida.com, LLC 18 Vapor withdrawal compressor failure – Table 3.3.2.1 2470.0 failures / 106 hours Æ 21.6 failures per year Operator Failure – Simplified Method Conditions for PFD=0.1 are not met – use PFD = 1.0 Relief valve fails – Table 4.3.3.1 4.15 failures / 103 demands PFD = 0.00415 Step 3 – Select SIL (Individual Risk / Risk Integral) Ftarget = 1.0 x 10⁻⁴ / 0.15 = 6.67 x 10⁻⁴ PFD = 6.67 x 10⁻⁴ / 0.0896 = 7.44 x 10⁻³ RRF = 134 SIL = 3 (or SIL 2 with a RRF suitably greater than 134) Copyright © 2000-2006, exida.com, LLC 19
