I. Estadística Descriptiva de dos variables
Anuncio
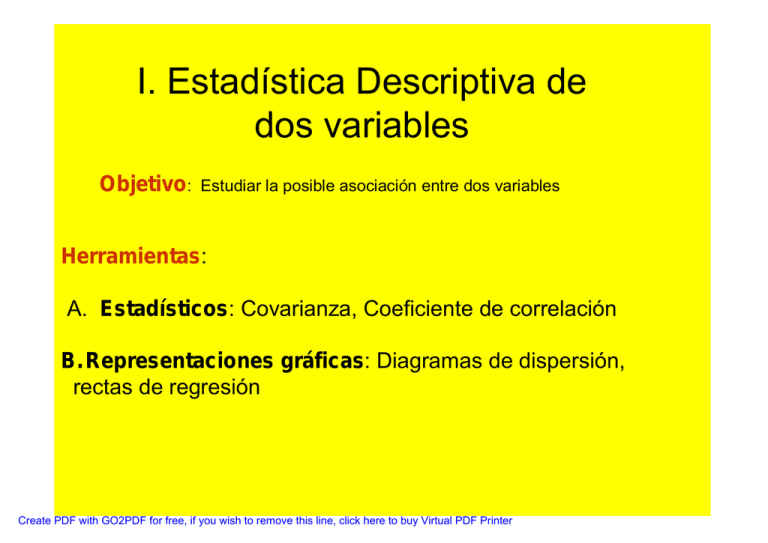
I. Estadística Descriptiva de dos variables Objetivo: Estudiar la posible asociación entre dos variables Herramientas: A. Estadísticos: Covarianza, Coeficiente de correlación B. Representaciones gráficas: Diagramas de dispersión, rectas de regresión Create PDF with GO2PDF for free, if you wish to remove this line, click here to buy Virtual PDF Printer Guión • • Ø Ø • Ø Ø II.1 Diagramas de Dispersión II.2 Medidas de Asociación Covarianza Coeficiente de correlación II.3 Regresión Regresión lineal Regresión No lineal Create PDF with GO2PDF for free, if you wish to remove this line, click here to buy Virtual PDF Printer 2 Diagrama de dispersión Variable explicativa x Variable respuesta y Suponemos que la variable y depende de la variable x. A veces solo queremos ver si hay asociación y de que tipo Diagrama de dispersión Gráfico en el que se representan los puntos (x_i, y_i) Cerebro CI Escalado Grados Consumo Cerebro CI Create PDF with GO2PDF for free, if you wish to remove this line, click here to buy Virtual PDF Printer ¿Qué se observa en el diagrama de dispersión? Asociación: fuerte o débil Asociación: negativa o positiva Asociación: lineal o no lineal Create PDF with GO2PDF for free, if you wish to remove this line, click here to buy Virtual PDF Printer 3. Medidas de Asociación Covarianza muestral : Muestra la relación entre los datos 1 n 1 n cov x , y = ∑ ( xi − x )( yi − y ) = ( ∑ xiyi ) −xy n i =1 n i =1 Asociación positiva cov >0 Asociación negativa cov <0 No Asociación cov ~0 Create PDF with GO2PDF for free, if you wish to remove this line, click here to buy Virtual PDF Printer ¡Depende de las Unidades! 3 Regresión • Regresion Lineal Se trata de buscar la recta que aproxima mejor los datos Create PDF with GO2PDF for free, if you wish to remove this line, click here to buy Virtual PDF Printer P¿Como se halla la recta de regresión? • Se busca una recta y=a+bx, tales que los coeficientes a y b minimizen, 1 ECM = n n ∑ ( yi − a − bxi)2 i =1 Respuesta (Derivando) cov xy a=y− v x x cov x , y b= vx cov xy y−y = (x − x) vx Create PDF with GO2PDF for free, if you wish to remove this line, click here to buy Virtual PDF Printer • Recta de Regresión 3. Medidas de Asociación Coeficiente de correlación (Pearson) : Muestra la relación (lineal) entre los datos C ovx, y r = v xv y Asociación fuerte y positiva r~ 1 Asociación fuerte y negativa r ~-1 No Asociación Create PDF with GO2PDF for free, if you wish to remove this line, click here to buy Virtual PDF Printer r ~0 Relación entre la recta de Regresión y el coeficiente de correlación E.CM = vy (1 − r ) 2 1 n cov xy 2 E .CM = ∑ ( yi − y + ( x − xi )) n i =1 vx vy vx cov xy 1 n cov xy 2 cov xy 2 2 ( yi − y ) + ( ) ( x − xi ) − 2( yi − y )( x − xi ) ∑ n i =1 vx vx (cov x , y )2 = vy − = vy − vyr 2 vx Create PDF with GO2PDF for free, if you wish to remove this line, click here to buy Virtual PDF Printer Coeficiente de correlación • No depende de las unidades • No es robusto (depende de datos atípicos) • r 2 =% de la variacion de y que se debe a la variación de x • Solo mide relaciones lineales Create PDF with GO2PDF for free, if you wish to remove this line, click here to buy Virtual PDF Printer 3 Regresión no lineal • Regresion No Lineal Se trata de buscar una curva que aproxime los datos de la mejor manera posible. Puede ser exponencial polinomial,etc Create PDF with GO2PDF for free, if you wish to remove this line, click here to buy Virtual PDF Printer ¿Como se calcula? y = ae bx Ln ( y ) = Ln ( a ) + bx z Se hace la regresión de la nueva variable Z sobre X Create PDF with GO2PDF for free, if you wish to remove this line, click here to buy Virtual PDF Printer ¿Cómo hacemos regresión logaritmica? z y = a + Ln( x ) Y = a + bLn( x ) Se hace la regresión de la variable Y sobre Z Create PDF with GO2PDF for free, if you wish to remove this line, click here to buy Virtual PDF Printer ¿Cómo hacemos regresión potencial? W y = a( x) b z Ln (Y ) = Ln( a ) + bLn( x ) Se hace la regresión de la variable W sobre Z Create PDF with GO2PDF for free, if you wish to remove this line, click here to buy Virtual PDF Printer ¿Cómo se predice el futuro con los modelos de regresión? y = f ( x) Modelo de Regresión ¿Que valor predice para un valor x de la variable respuesta? Create PDF with GO2PDF for free, if you wish to remove this line, click here to buy Virtual PDF Printer Concentración de NO2 en una ciudad de Noruega (tabla parcial de datos) Concent 3.71844 3.10009 3.31419 4.38826 4.3464 4.16044 4.01277 2.15176 3.157 2.37955 3.83298 4.48187 4.0483 4.00186 3.2308 4.67189 2.73437 3.49651 3.67122 3.67377 3.15274 3.42751 4.32413 3.65584 Cars 7.6912 7.69894 4.81218 6.95177 7.51806 7.67183 5.52545 4.68213 7.15618 4.74493 5.81114 8.10892 8.31385 5.22036 6.40853 7.3192 6.6174 7.76938 6.4677 7.65064 7.75061 5.18178 7.63964 8.00703 Temp WindSp 9.2 4. 6.4 3.5 -3.7 0.9 -7.2 1.7 -1.3 2.6 2.6 1.6 -7.9 1.6 -4.1 3.8 -12.7 5.2 -1.6 3 -3.1 1.8 1 1.2 12.2 4 -1.5 2.4 -0.9 3 -8.5 0.8 6.5 4.2 -1.1 2.5 0.8 3.4 8.2 4.5 0.2 0.4 -2.1 4.3 -2.8 6 TempDiff 8 -0.3 -0.1 1.2 -0.1 0.3 0.3 -0.1 -0.1 0.4 0.3 1.5 -2.8 0.9 0.1 2.9 4.1 7.1 1 -0.4 0.2 0.2 -0.2 -0.2 WindDir 74.4 20 56 281.3 4 74 65 224.2 211.9 63.1 64.5 58.3 78 215 230.4 82.7 235 282.4 88 19. 3 277 70 307 230 41.4 11 62.5 15 Create PDF with GO2PDF for free, if you wish to remove this line, click here to buy Virtual PDF Printer Hour Day 600 14 196 513 23 143 11 115 19 527 5 502 4 453 12 462 3 554 2 55 18 47 17 572 5 556 1 69 20 447 24 186 10 550 6 142 12 167 14 32 5 112 432 453 Análisis con todos los datos r = 0.5121 Create PDF with GO2PDF for free, if you wish to remove this line, click here to buy Virtual PDF Printer Correlación con parte de los datos r = 0.774 Create PDF with GO2PDF for free, if you wish to remove this line, click here to buy Virtual PDF Printer ¡Cuidado! • Correlaciones y datos atípicos • Correlaciones y heterogeneidad • Correlaciones espurias Create PDF with GO2PDF for free, if you wish to remove this line, click here to buy Virtual PDF Printer
