Hombres Mujeres Total Hombres Mujeres TOTAL . . . 348 206 142
Anuncio
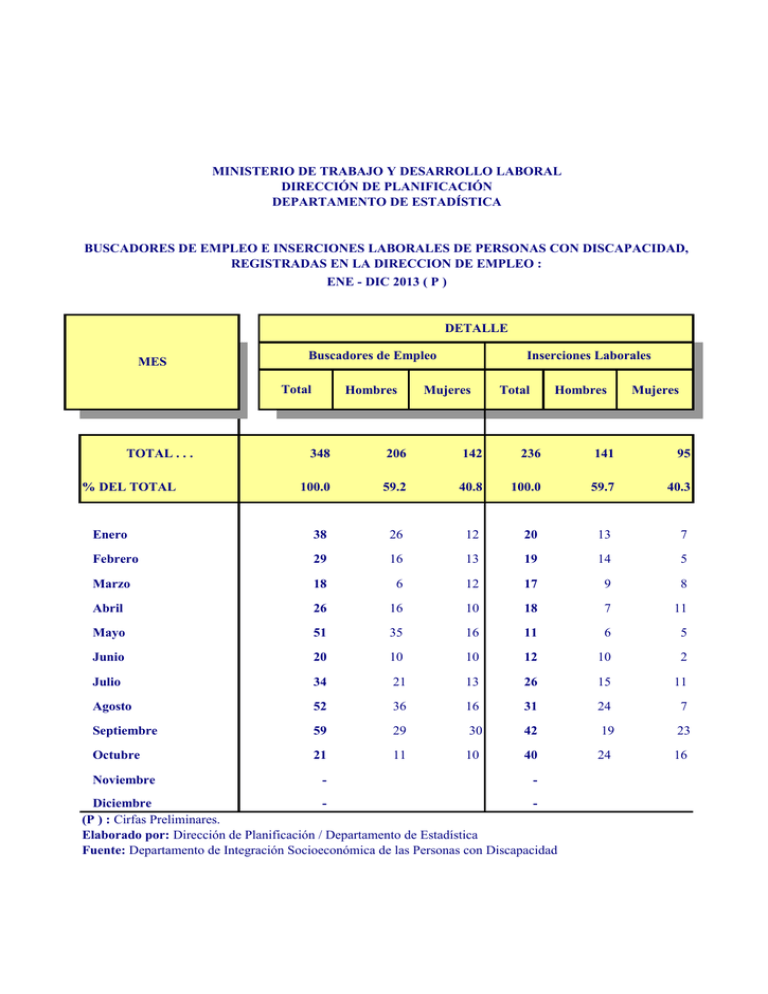
MINISTERIO DE TRABAJO Y DESARROLLO LABORAL DIRECCIÓN DE PLANIFICACIÓN DEPARTAMENTO DE ESTADÍSTICA BUSCADORES DE EMPLEO E INSERCIONES LABORALES DE PERSONAS CON DISCAPACIDAD, REGISTRADAS EN LA DIRECCION DE EMPLEO : ENE - DIC 2013 ( P ) DETALLE MES Buscadores de Empleo Total TOTAL . . . Hombres Inserciones Laborales Mujeres Total Hombres Mujeres 348 206 142 236 141 95 100.0 59.2 40.8 100.0 59.7 40.3 Enero 38 26 12 20 13 7 Febrero 29 16 13 19 14 5 Marzo 18 6 12 17 9 8 Abril 26 16 10 18 7 11 Mayo 51 35 16 11 6 5 Junio 20 10 10 12 10 2 Julio 34 21 13 26 15 11 Agosto 52 36 16 31 24 7 Septiembre 59 29 30 42 19 23 Octubre 21 11 10 40 24 16 % DEL TOTAL Noviembre - - Diciembre (P ) : Cirfas Preliminares. Elaborado por: Dirección de Planificación / Departamento de Estadística Fuente: Departamento de Integración Socioeconómica de las Personas con Discapacidad MINISTERIO DE TRABAJO Y DESARROLLO LABORAL DIRECCIÓN DE PLANIFICACIÓN DEPARTAMENTO DE ESTADÍSTICA BUSCADORES DE EMPLEO DE PERSONAS CON DISCAPACIDAD, REGISTRADAS EN LA DIRECCION DE EMPLEO, SEGÚN TIPO DE DISCAPACIDAD Y SEXO : ENE - DIC 2013 ( P ) MESES TIPO DE DISCAPACIDAD Y SEXO Total Ene. Feb. Mar TOTAL . . . 348 38 29 HOMBRES 206 26 MUJERES 142 12 Abr May Jun Jul Ago Sep Oct Nov 18 26 51 20 34 52 59 21 - - 16 6 16 35 10 21 36 29 11 - - 13 12 10 16 10 13 16 30 10 - - - - - - - - - - - - - - 32 1 - 2 3 9 1 2 5 4 5 Hombres 18 1 - 2 2 5 - 1 4 1 2 Mujeres 14 - - 1 4 1 1 1 3 3 Visual 101 18 5 2 11 14 9 10 11 16 5 65 36 14 4 4 1 2 5 6 11 3 5 4 7 3 8 3 8 8 3 2 78 11 7 5 3 2 4 11 16 16 3 Hombres 45 7 4 1 3 2 3 8 8 8 1 Mujeres 33 4 3 4 - - 1 3 8 8 2 Intelectual 97 - 11 7 4 22 3 7 16 22 5 Hombres 57 - 4 2 3 14 1 4 14 12 3 Mujeres 40 - 7 5 1 8 2 3 2 10 2 Psiquiatria 16 8 1 - 3 1 1 - 1 - 1 Hombres 9 4 1 - 2 - 1 - - - 1 Mujeres 7 4 - - 1 1 - - 1 - - 24 - 5 2 2 3 2 4 3 1 2 Hombres 12 - 3 1 1 3 - 1 2 - 1 Mujeres 12 - 2 1 1 - 2 3 1 1 1 Auditiva Hombres Mujeres Física Organos y Sistemas Multiples Dic (P ) : Cirfas Preliminares. Elaborado por: Dirección de Planificación / Departamento de Estadística Fuente: Departamento de Integración Socioeconómica de las Personas con Discapacidad MINISTERIO DE TRABAJO Y DESARROLLO LABORAL DIRECCIÓN DE PLANIFICACIÓN DEPARTAMENTO DE ESTADÍSTICA INSERCIONES DE EMPLEO A PERSONAS CON DISCAPACIDAD, REGISTRADAS EN LA DIRECCION DE EMPLEO, SEGÚN TIPO DE DISCAPACIDAD Y SEXO : ENE - DIC 2013 ( P ) MESES TIPO DE DISCAPACIDAD Y SEXO Total Ene. Feb. Mar Abr TOTAL . . . 236 20 19 17 HOMBRES 141 13 14 MUJERES 95 7 5 May Jun Jul Ago Sep Oct Nov 18 11 12 26 31 42 40 - - 9 7 6 10 15 24 19 24 - - 8 11 5 2 11 7 23 16 - - - - - - - - - - - - - - 19 2 2 - 4 - - 3 1 2 5 Hombres 10 2 2 - 2 - - - 1 1 2 Mujeres 9 - - - 2 - - 3 - 1 3 64 6 5 8 2 2 7 3 10 12 9 32 32 2 4 3 2 2 6 2 2 - 6 1 2 1 8 2 4 8 3 6 65 2 3 5 6 - 1 9 9 19 11 Hombres 42 1 2 4 3 - 1 6 6 11 8 Mujeres 23 1 1 1 3 - - 3 3 8 3 Intelectual 60 3 5 3 3 8 2 9 11 8 8 Hombres 39 2 4 2 1 4 1 7 9 3 6 Mujeres 21 1 1 1 2 4 1 2 2 5 2 Psiquiatria 9 4 - - 2 - - - - - 3 Hombres 6 3 - - 1 - - - - - 2 Mujeres 3 1 - - 1 - - - - - 1 19 3 4 1 1 1 2 2 - 1 4 Hombres 12 3 3 1 - - 2 - - - 3 Mujeres 7 - 1 - 1 1 - 2 - 1 1 Visual Auditiva Hombres Mujeres Física Organos y Sistemas Multiples Dic (P ) : Cirfas Preliminares. Elaborado por: Dirección de Planificación / Departamento de Estadística Fuente: Departamento de Integración Socioeconómica de las Personas con Discapacidad
