The Concentration of Mexican Enterprises by Economic Strata and
Anuncio
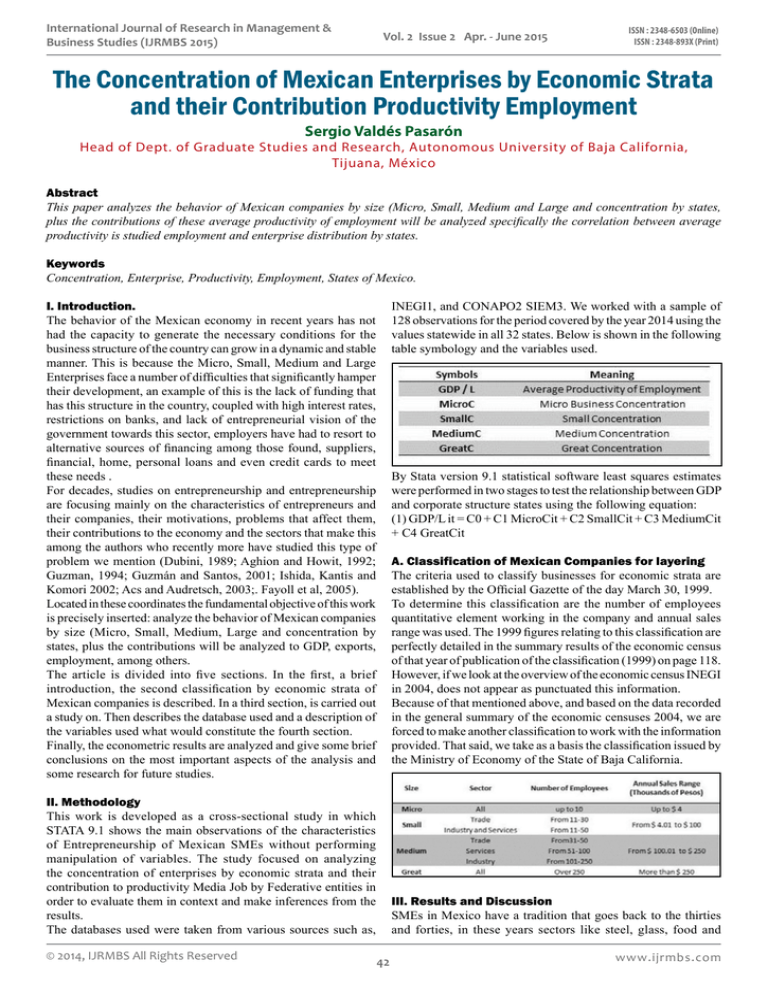
International Journal of Research in Management & Business Studies (IJRMBS 2015) Vol. 2 Issue 2 Apr. - June 2015 ISSN : 2348-6503 (Online) ISSN : 2348-893X (Print) The Concentration of Mexican Enterprises by Economic Strata and their Contribution Productivity Employment Sergio Valdés Pasarón Head of Dept. of Graduate Studies and Research, Autonomous University of Baja California, Tijuana, México Abstract This paper analyzes the behavior of Mexican companies by size (Micro, Small, Medium and Large and concentration by states, plus the contributions of these average productivity of employment will be analyzed specifically the correlation between average productivity is studied employment and enterprise distribution by states. Keywords Concentration, Enterprise, Productivity, Employment, States of Mexico. INEGI1, and CONAPO2 SIEM3. We worked with a sample of 128 observations for the period covered by the year 2014 using the values statewide in all 32 states. Below is shown in the following table symbology and the variables used. I. Introduction. The behavior of the Mexican economy in recent years has not had the capacity to generate the necessary conditions for the business structure of the country can grow in a dynamic and stable manner. This is because the Micro, Small, Medium and Large Enterprises face a number of difficulties that significantly hamper their development, an example of this is the lack of funding that has this structure in the country, coupled with high interest rates, restrictions on banks, and lack of entrepreneurial vision of the government towards this sector, employers have had to resort to alternative sources of financing among those found, suppliers, financial, home, personal loans and even credit cards to meet these needs . For decades, studies on entrepreneurship and entrepreneurship are focusing mainly on the characteristics of entrepreneurs and their companies, their motivations, problems that affect them, their contributions to the economy and the sectors that make this among the authors who recently more have studied this type of problem we mention (Dubini, 1989; Aghion and Howit, 1992; Guzman, 1994; Guzmán and Santos, 2001; Ishida, Kantis and Komori 2002; Acs and Audretsch, 2003;. Fayoll et al, 2005). Located in these coordinates the fundamental objective of this work is precisely inserted: analyze the behavior of Mexican companies by size (Micro, Small, Medium, Large and concentration by states, plus the contributions will be analyzed to GDP, exports, employment, among others. The article is divided into five sections. In the first, a brief introduction, the second classification by economic strata of Mexican companies is described. In a third section, is carried out a study on. Then describes the database used and a description of the variables used what would constitute the fourth section. Finally, the econometric results are analyzed and give some brief conclusions on the most important aspects of the analysis and some research for future studies. By Stata version 9.1 statistical software least squares estimates were performed in two stages to test the relationship between GDP and corporate structure states using the following equation: (1) GDP/L it = C0 + C1 MicroCit + C2 SmallCit + C3 MediumCit + C4 GreatCit A. Classification of Mexican Companies for layering The criteria used to classify businesses for economic strata are established by the Official Gazette of the day March 30, 1999. To determine this classification are the number of employees quantitative element working in the company and annual sales range was used. The 1999 figures relating to this classification are perfectly detailed in the summary results of the economic census of that year of publication of the classification (1999) on page 118. However, if we look at the overview of the economic census INEGI in 2004, does not appear as punctuated this information. Because of that mentioned above, and based on the data recorded in the general summary of the economic censuses 2004, we are forced to make another classification to work with the information provided. That said, we take as a basis the classification issued by the Ministry of Economy of the State of Baja California. II. Methodology This work is developed as a cross-sectional study in which STATA 9.1 shows the main observations of the characteristics of Entrepreneurship of Mexican SMEs without performing manipulation of variables. The study focused on analyzing the concentration of enterprises by economic strata and their contribution to productivity Media Job by Federative entities in order to evaluate them in context and make inferences from the results. The databases used were taken from various sources such as, © 2014, IJRMBS All Rights Reserved III. Results and Discussion SMEs in Mexico have a tradition that goes back to the thirties and forties, in these years sectors like steel, glass, food and 42 www.ijrmbs.com ISSN : 2348-6503 (Online) ISSN : 2348-893X (Print) International Journal of Research in Management & Business Studies (IJRMBS 2015) Vol. 2 Issue 2 Apr. - June 2015 beverages, textiles emerged among others, these pioneers sectors of SMEs only several have survived a few who currently remain family businesses operated by third and even fourth generations (Sánchez 2002), the characteristics of these companies were that were managed by entrepreneurs with little education and even illiterate In the last decade of the twentieth century developed better opportunities in finance (investment, treasury) and trade, which led to several employers stop production of goods and services to pursue this matter to be more profitable with less risk in that period. The Mexican economy was affected by exchange rate adjustments in late 1994 caused that most entrepreneurs have to face huge losses they cannot afford the new peso - dollar. Given this scenario in December 1994 devaluation with the consequence that existing Much of Mexican companies in that period could not meet their commitments acquired in foreign currency debtors who had made an average exchange rate of 3.30 pesos is given by dollar before July 1994 and passing this parity in December of that year to 9.90 pesos per dollar representing this an over 100% increase. This caused the mass closure of companies, suspension of payments to banks and together produced a process of deindustrialization. The economic census INEGI at that time threw for 1999 representing a total of 99.7 percent. Of the total, micro enterprises in sectors (industry, trade and services) averaged 95. 7 percent, meanwhile small firms averaged 3.1 percent and midsize businesses accounted for 0.3 percent. The total number of registered economic censuses of 1999 companies was 2,844,308, occupying a total of 14,825,994 employees. With the arrival of the government of Vicente Fox (2000-2006), several measures to continue policies promoted by his predecessor were taken, ample impetus was given to industrial development in particular the promotion of micro, despite not having achieved the results projected as significant fluctuations were observed in some states of the republic. In 2003 Mexico's GDP was 615 657 million, therefore, the contribution of SMEs to GDP was 317 679 million.By the 2004's SMEs by sector activity were distributed as follows: 49. 4 percent was engaged in commercial activities, absorbing 25.6 percent of employees, followed in importance by services with 37 percent, receiving 45.6 percent of workers eventually involved industrial activity with 11.2 percent and 19.6 of employees occupied, the rest was devoted to other activities and employed 9 percent. Another aspect is how you are contributing to regional development, among the states with greater involvement of SMEs there are seven states: State of Mexico (12.1%), Federal District (11.4%), Jalisco (7.1%), Veracruz de Ignacio de la Key (6.1%), Puebla (5.5%), Guanajuato (5.0%) and Michoacán de Ocampo (4.7%). In total amounted to 52 percent. By 2006 there were moderate decline in business in some states, for example Baja California 12.704 companies had in 2001 reported in 2006 a total of 10541 businesses, Nuevo León of 26989 companies in 2001 in 2006 reported 17364, this was not widespread because there was some case where increase was reported for example in Mexico City 2001 117 961 2006 124 443 achievement take (Figure.1). www.ijrmbs.com 43 Fig.1: Incomes by states. Source: Based on data from the Mexican Business Information System (SIEM) From 2007 to assume the presidency Felipe Calderón Hinojosa, a policy of support for SMEs was promoted managing unify the federal government to support these businesses and investing in job creation. Their policy measures for development were reflected in the National Development Plan 2007 - 2012 (Government of the United States of Mexico, 2007). According to data from the Ministry of Economy micro enterprises had the largest number of companies accounting for 93% of all enterprises by federal entities of the country (Figure 2) followed by the Middle (1%), small (5%) and large (1%) being the most Micro company in the total composition of enterprises by stratum in this year (Figure 4.2). This reveals that the micro company is an important factor in the generation of public policies in order to substantially increase economic growth area. Fig. 2: Total business by states Source: Based on data from the Mexican Business Information System (SIEM) Once all the regressions and analyzing thrown results can conclude that despite the possible existence of problems with the data used for estimates the empirical relationships are expected, there is a positive relationship between corporate concentration by economic stratum and average productivity of employment (A higher concentration by type of major companies will be the average productivity of employment although there is no significance statistics. We can summarize that the concentration and greater employment generation in micro businesses. We could attribute this phenomenon to that large companies made reductions in their number of employees in order to reduce fixed costs they generate one you see that the worker is unemployed the fastest way to survive is the generation of self-employment with the creation of micro businesses. © All Rights Reserved, IJRMBS 2014 International Journal of Research in Management & Business Studies (IJRMBS 2015) Vol. 2 Issue 2 Apr. - June 2015 Española.Revista de Economía, número 780, septiembre, páginas 21-33, Madrid. [10]. CAVES, R. E. (1971): «International Corporations: The Industrial Economics of ForeignInvestment», Economica, 38 (febrero), páginas 1-27. [11]. COURLET, C. y SOULAGE, B. (1995): «Dinámicas industriales y territorio», en VÁZQUEZ BARQUERO, A. y GAROFOLI, G. (eds.), Desarrollo Económico Local en Europa, primera edición, Colegio de Economistas, Madrid. [12]. DAVIDSSON, P. (2005): «Methods Issues in the Study of Venture Start-up Processes», en FAYOLL, A.; KYRÖ, P. y ULIJN, J. (edited by) (2005): Entrepreneurship Research in Europe. Outcomesand Perspectives, Edward Elgar, Reino Unido y EE UU. [13]. DESTINOBLES, A. G. (2006): El capital humano en las teorías del crecimiento económico, edición electrónica, eumet.net. [14]. DUBINI, P. (1989): «The Influence of Motivation and Enviroment on Business Stara-ups: Some Hints for Public Policies », Journal of Business Venturing, volumen 4, número 1, páginas 11-26. [15]. DUNNING, J. H. (1995): «Revisión del paradigma ecléctico en una época de capitalismo de alianzas», EconomíaIndustrial, 305, 15-32, Madrid. [16]. DURÁN, J. J. (2000): «La inversión directa extranjera en el Siglo XX. La persistente multinacionalización de la empresa », Revista de Economía Mundial, 3, 121-148, Huelva. [17]. FELDMAN, M. P. y AUDRETSCH, D. B. (1999): «Innovationin Cities: Science-based Diversity, Specialization and LocalizedMonopoly», European Economic Review, 43, 409-429. [18]. GAROFOLI, G.:(1994): «Economic Development, Organization of Production and Territory», en GAROFOLI, G. yVÁZQUEZ BARQUERO, A. (ed.), Organization of Productionand Territory: Local Models of Development, Universitádeglistudi de Pavia, Pavia. [19]. HIRCHSMAN, A. O. (1961): La estrategia del desarrolloeconómico, Fondo de Cultura Económica, México. [20]. SCHULTZ, T. (1985): Invirtiendo en la gente: la cualificaciónpersonal como motor económico, Ariel, Barcelona. [21]. SCHUMPETER, J. A. (1976): Teoría del desenvolvimientoeconómico, Fondo de Cultura Económica, México. Primeraedición en alemán de 1911: Theorie der WirtschaftlichenEntwicklung, VerlagDunker and Humbolt, Múnich. [22]. SCHUMPETER, J. A. (1983): Capitalismo, socialismoy democracia, Ediciones Orbis, Barcelona. Primeraedicióneninglés: Capitalism, Socialism and Democracy, Harper and Row, Nueva York. [23]. SOETE, L. (1987): «The Impact of Technological Innovationon International Trade Patterns: The Evidence Reconsidered», Research Policy, volumen 16, números 2-4, 101-130. [24]. SOLOW, R. M. (1957): «Technical Change and theAggregate Production Function», Review of Economics andStatistics, 57. [25]. STIGLITZ, J. E. y WEISS, A. (1987): «Credit Rationingwith Many Borrowers», American Economic Review,77, 228- Source: Results of the Econometric estimates in Stata 9.1. Fig. 3: Concentration of Micro Employment and Productivity. Source: Results of the Econometric estimates in Stata 9.1 References [1]. ACS, Z. J. y AUDRETSCH, D. B. (2003): «Innovation and Technological Change», en ACS, Z. J. y AUDRETSCH, D. B. (ed.), Hand Book of Entrepreneurship Research, primeraedición, Kluwer Academic Publishers, The Netherlands, Dordrecht. [2]. AGHION, P. y HOWIT, P. (1992): «A Model of Growth Through Creative Destruction», Econometrica, 60, 323351. [3]. ANG, J. (1991): «The Theory of Small Business Uniqueness and Financial Mangement», Journal of Small BusinessFinance, 1, 1-13. [4]. AUDRETSCH, D. y THURIK, R. (2004): «A Model of the Entrepreneurial Economy», International Journal of EntrepreneurshipEducation, 2 (2), 143-166. [5]. BIRCH, DL. (1979): The Job Generation Process, MIT Program on Neighbourhood and Regional Change, Cambridge (Mass). [6]. CÁCERES, F. R. (2001): «Comercio Exterior y Estructuras Productivas de los Países de la UE: Convergencia y Asimetrías », Revista de Economía Mundial, 4, 207-225, Huelva. [7]. CÁCERES, F. R. y ROMERO, I. (2006): «Empresarios versus propietarios de pequeños negocios: una aproximación basada en el tamaño empresarial», Estudios de EconomíaAplicada, 24, 2, 545-566, Madrid. [8]. CARRE, M. y THURIK, R. (2003): «The Impact of Entrepreneurship on Economic Growth», en AUDRETSCH, D. B. y ACS, Z. J. (eds.), Handbook of Entrepreneurship Research,primeraedición, páginas 437-471, Kluwer Academic Publishers, Boston. [9]. CARRERA, M. y MARTÍNEZ, A. R. (1999): «Comercio intraindustrial y shocks simétricos: implicaciones para la Unión Monetaria Europea», Información Comercial © 2014, IJRMBS All Rights Reserved ISSN : 2348-6503 (Online) ISSN : 2348-893X (Print) 44 www.ijrmbs.com ISSN : 2348-6503 (Online) ISSN : 2348-893X (Print) International Journal of Research in Management & Business Studies (IJRMBS 2015) Vol. 2 Issue 2 Apr. - June 2015 231. [26]. VAN STEL, A.; CARRE, M. y THURIK, R. (2005): «TheEffect of Entrepreneurial Activity on National EconomicGrowth», Discussion Paper on Entrepreneurship, Growth andPublic Policy, Max Planck Institute For Economic Systems,Group Entrepreneurship, Growth and Public Policy, Alemania. [27]. VÁZQUEZ BARQUERO, A. (1999): Desarrollo, redes einnovación. Lecciones sobre desarrollo endógeno, Pirámide,Madrid. [28]. VESPARGEN, B. (1992): «Endogenous Innovation inNeo-Clasical Growth Models: A Survey», Journal of Macroeconomics,14, 631-662. [29]. VERNON, R. (1966): «International Trade and InternationalInvestment in the Product Cycle», Quarterly Journal ofEconomics, volumen 83, número 1, 190-207. [30]. WENNEKERS, S. y THURIK, R. (1999): «Linking Entrepreneurship and Economic Growth», Small Business Economics, volumen 13, 1. [31]. WILLIAMSON, O. E. (1975): Markets and Hierarchies: Analysis and Antitrust Implications, The Free Press, Nueva York. [32]. WYNARCZYK, P. y WATSON, R. (2005): «FirmGrowth and Supply Chain Partnerships: An Empirical Analysisof U.K. SME Subcontractors»; Small Business Economics, volumen 24, número 1, enero, páginas 39-51. [33]. WOMACK, J. y JONES, D. (1996): Lean Thinking: BanishWaste and Create Wealth in Your Corporation, SimonSchuster, NewYork. [34]. http://www.bajacalifornia.gob.mx/sedeco [35]. http://www.banxico.org.mx [36]. http://www.INEGI.gob.mx [37]. http://www.bajacalifornia.gob.mx/sedeco www.ijrmbs.com 45 © All Rights Reserved, IJRMBS 2014


