Agriculture and Fisheries Agricultura y Pesca
Anuncio
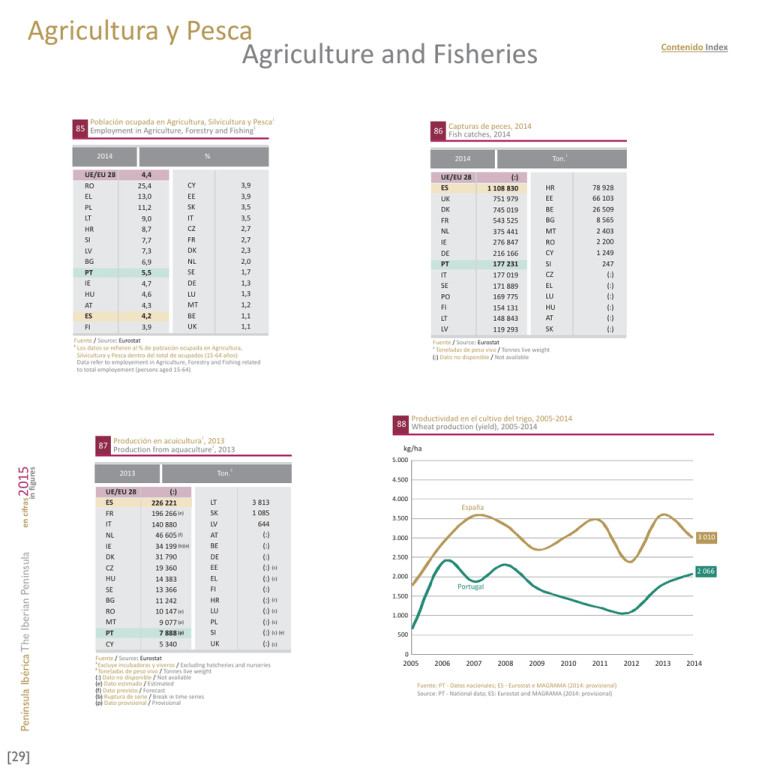
Agricultura y Pesca Agriculture and Fisheries Población ocupada en Agricultura, Silvicultura y Pesca 1 Capturas de peces, 2014 85 Employment in Agriculture, Forestry and Fishing1 86 Fish catches, 2014 % 2014 UE/EU 28 RO EL PL LT HR SI LV BG PT IE HU AT ES FI 4,4 25,4 13,0 11,2 9,0 8,7 7,7 7,3 6,9 5,5 4,7 4,6 4,3 4,2 3,9 Contenido Index Ton. 2014 UE/EU 28 ES UK DK FR NL IE DE PT IT SE PO FI LT LV 3,9 3,9 3,5 3,5 2,7 2,7 2,3 2,0 1,7 1,3 1,3 1,2 1,1 1,1 CY EE SK IT CZ FR DK NL SE DE LU MT BE UK Fuente / Source: Eurostat 1 Los datos se refieren al % de población ocupada en Agricultura, Silvicultura y Pesca dentro del total de ocupados (15-64 años) Data refer to employement in Agriculture, Forestry and Fishing related to total employement (persons aged 15-64) (:) 1 108 830 751 979 745 019 543 525 375 441 276 847 216 166 177 231 177 019 171 889 169 775 154 131 148 843 119 293 1 78 928 66 103 26 509 8 565 2 403 2 200 1 249 247 (:) (:) (:) (:) (:) (:) HR EE BE BG MT RO CY SI CZ EL LU HU AT SK Fuente / Source: Eurostat Toneladas de peso vivo / Tonnes live weight (:) Dato no disponible / Not available 1 Productividad en el cultivo del trigo, 2005-2014 88 Wheat production (yield), 2005-2014 1 Producción en acuicultura , 2013 87 Production from aquaculture1, 2013 kg/ha Península Ibérica The Iberian Peninsula en cifras in figures 2015 5.000 [29] Ton. 2013 2 4.500 UE/EU 28 ES FR IT NL IE DK CZ HU SE BG RO MT PT CY (:) 226 221 196 266 (e) 140 880 46 605 (f) 34 199 (b)(e) 31 790 19 360 14 383 13 366 11 242 10 147 (e) 9 077 (p) 7 888 (p) 5 340 LT SK LV AT BE DE EE EL FI HR LU PL SI UK 3 813 1 085 644 (:) (:) (:) (:) (c) (:) (c) (:) (:) (c) (:) (c) (:) (c) (:) (c) (e) (:) (c) Fuente / Source: Eurostat 1 Excluye incubadoras y viveros / Excluding hatcheries and nurseries 2 Toneladas de peso vivo / Tonnes live weight (:) Dato no disponible / Not available (e) Dato estimado / Estimated (f) Dato previsto / Forecast (b) Ruptura de serie / Break in time series (p) Dato provisional / Provisional 4.000 España 3.500 3 010 3.000 2.500 2 066 2.000 Portugal 1.500 1.000 500 0 2005 2006 2007 2008 2009 2010 2011 Fuente: PT - Datos nacionales; ES - Eurostat e MAGRAMA (2014: provisional) Source: PT - National data; ES: Eurostat and MAGRAMA (2014: provisional) 2012 2013 2014 Agricultura y Pesca Agriculture and Fisheries Contenido Index 1 Productividad en el cultivo del maíz, 2005-2014 Producción de vino, 2005-2014 89 Grain maize and corn-cob-mix production (yield), 2005-2014 90 Wine production, 2005-20141 kg/ha 1000 hl 12 000 60 000 11 090 11 000 53 550 50 000 España 10 000 España 40 000 9 000 8 333 8 000 30 000 7 000 20 000 Portugal 6 000 10 000 5 000 6 238 Portugal 2005 2006 2007 2008 2009 2010 2011 2012 2013 0 2005 2014 2006 2007 2008 2009 Exportación de tomate preparado o conservado, 2005-2014 91 Exported tomatoes, prepared or preserved, 2005-2014 Miles de toneladas Thousand tonnes 450 Millones / Million € 350 400 Península Ibérica The Iberian Peninsula en cifras in figures 2015 300 [30] 350 250 300 200 250 150 200 150 100 100 50 50 0 0 2005 2006 2007 2008 2009 Valor de la exportación Exports value Portugal Fuente / Source: Eurostat 2010 2011 2012 Fuente / Source: Eurostat 1 Los datos se refieren al año de comercialización / Data refer to marketing year Fuente: PT - Datos nacionales; ES - Eurostat / Source: PT - National data; ES: Eurostat 2010 2011 2012 2013 Cantidad exportada Exports quantity España Portugal España 2014 2013 2014
