BALANCE GENERAL MENSUAL ACTIVO PASIVO CONTINGENTES
Anuncio
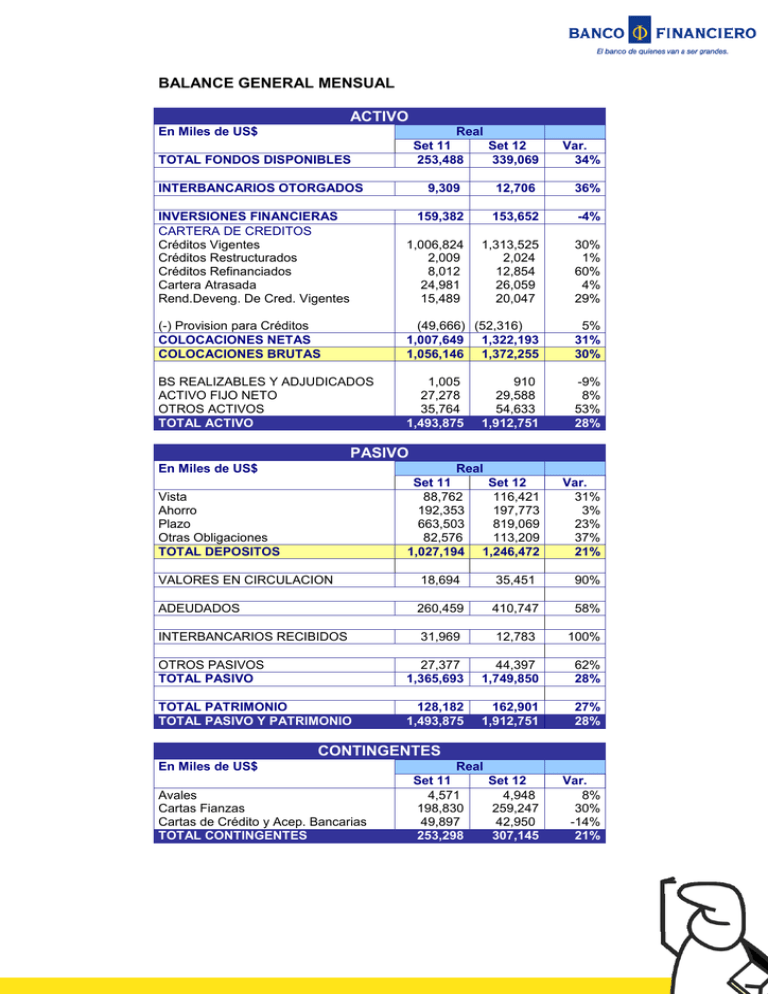
BALANCE GENERAL MENSUAL ACTIVO En Miles de US$ Real Set 11 Set 12 253,488 339,069 TOTAL FONDOS DISPONIBLES INTERBANCARIOS OTORGADOS Var. 34% 9,309 12,706 36% INVERSIONES FINANCIERAS CARTERA DE CREDITOS Créditos Vigentes Créditos Restructurados Créditos Refinanciados Cartera Atrasada Rend.Deveng. De Cred. Vigentes 159,382 153,652 -4% 1,006,824 2,009 8,012 24,981 15,489 1,313,525 2,024 12,854 26,059 20,047 30% 1% 60% 4% 29% (-) Provision para Créditos COLOCACIONES NETAS COLOCACIONES BRUTAS (49,666) (52,316) 1,007,649 1,322,193 1,056,146 1,372,255 5% 31% 30% BS REALIZABLES Y ADJUDICADOS ACTIVO FIJO NETO OTROS ACTIVOS TOTAL ACTIVO 1,005 27,278 35,764 1,493,875 910 29,588 54,633 1,912,751 -9% 8% 53% 28% Real Set 11 Set 12 88,762 116,421 192,353 197,773 663,503 819,069 82,576 113,209 1,027,194 1,246,472 Var. 31% 3% 23% 37% 21% PASIVO En Miles de US$ Vista Ahorro Plazo Otras Obligaciones TOTAL DEPOSITOS VALORES EN CIRCULACION 18,694 35,451 90% ADEUDADOS 260,459 410,747 58% INTERBANCARIOS RECIBIDOS 31,969 12,783 100% OTROS PASIVOS TOTAL PASIVO 27,377 1,365,693 44,397 1,749,850 62% 28% TOTAL PATRIMONIO TOTAL PASIVO Y PATRIMONIO 128,182 1,493,875 162,901 1,912,751 27% 28% CONTINGENTES En Miles de US$ Avales Cartas Fianzas Cartas de Crédito y Acep. Bancarias TOTAL CONTINGENTES Real Set 11 4,571 198,830 49,897 253,298 Set 12 4,948 259,247 42,950 307,145 Var. 8% 30% -14% 21% ESTADO DE RESULTADOS ACUMULADO En Miles de US$ Ingresos Financieros Gastos Financieros Margen Financiero Bruto Ingresos No Financieros Netos Gastos Operativos Margen Operacional Ing. Extraordinario Neto Resultados antes de Provisiones Provisiones de Cartera Depreciación Amortización Utilidad Antes de Impuestos Impuesto a la Renta Utilidad Neta Real Set 11 Set 12 117,469 150,199 34,990 50,701 82,479 99,498 15,072 19,043 58,330 73,320 39,221 45,221 6,412 8,671 45,633 53,892 30,225 29,377 2,257 2,647 708 833 12,443 21,035 3,527 6,832 8,916 14,203 Var. 28% 45% 21% 26% 26% 15% 35% 18% -3% 17% 18% 69% 94% 59%
