3. La production d`électricité d`origine renouvelable : détails par
Anuncio

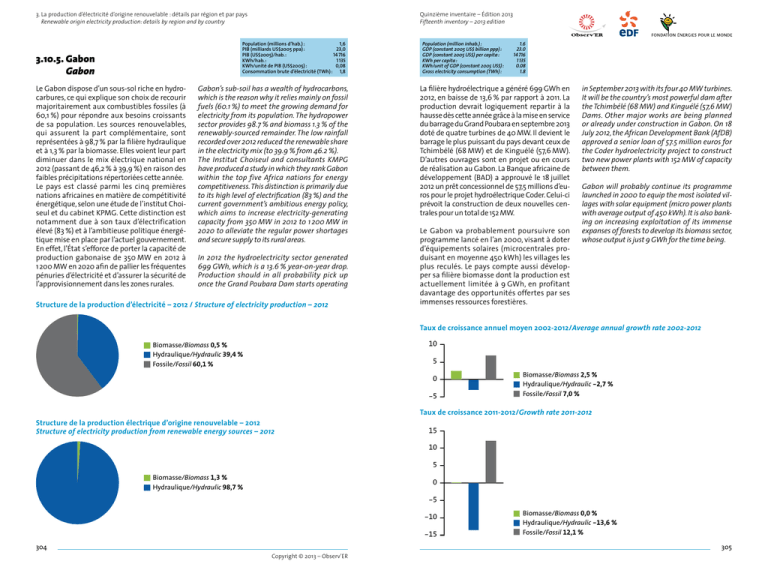
Quinzième inventaire – Édition 2013 Fifteenth inventory – 2013 edition 3. La production d’électricité d’origine renouvelable : détails par région et par pays Renewable origin electricity production: details by region and by country Population (millions d’hab.) : 1,6 PIB (milliards US$2005 ppa) : 23,0 PIB (US$2005)/hab. : 14 716 KWh/hab. : 1 135 KWh/unité de PIB (US$2005) : 0,08 Consommation brute d’électricité (TWh) : 1,8 3.10.5. Gabon Gabon Le Gabon dispose d’un sous-sol riche en hydrocarbures, ce qui explique son choix de recourir majoritairement aux combustibles fossiles (à 60,1 %) pour répondre aux besoins croissants de sa population. Les sources renouvelables, qui assurent la part complémentaire, sont représentées à 98,7 % par la filière hydraulique et à 1,3 % par la biomasse. Elles voient leur part diminuer dans le mix électrique national en 2012 (passant de 46,2 % à 39,9 %) en raison des faibles précipitations répertoriées cette année. Le pays est classé parmi les cinq premières nations africaines en matière de compétitivité énergétique, selon une étude de l’institut Choiseul et du cabinet KPMG. Cette distinction est notamment due à son taux d’électrification élevé (83 %) et à l’ambitieuse politique énergétique mise en place par l’actuel gouvernement. En effet, l’État s’efforce de porter la capacité de production gabonaise de 350 MW en 2012 à 1 200 MW en 2020 afin de pallier les fréquentes pénuries d’électricité et d’assurer la sécurité de l’approvisionnement dans les zones rurales. Gabon’s sub-soil has a wealth of hydrocarbons, which is the reason why it relies mainly on fossil fuels (60.1 %) to meet the growing demand for electricity from its population. The hydropower sector provides 98.7 % and biomass 1.3 % of the renewably-sourced remainder. The low rainfall recorded over 2012 reduced the renewable share in the electricity mix (to 39.9 % from 46.2 %). The Institut Choiseul and consultants KMPG have produced a study in which they rank Gabon within the top five Africa nations for energy competitiveness. This distinction is primarily due to its high level of electrification (83 %) and the current government’s ambitious energy policy, which aims to increase electricity-generating capacity from 350 MW in 2012 to 1 200 MW in 2020 to alleviate the regular power shortages and secure supply to its rural areas. In 2012 the hydroelectricity sector generated 699 GWh, which is a 13.6 % year-on-year drop. Production should in all probability pick up once the Grand Poubara Dam starts operating Structure de la production d’électricité – 2012 / Structure of electricity production – 2012 Population (million inhab.) : GDP (constant 2005 US$ billion ppp) : GDP (constant 2005 US$) per capita : KWh per capita : KWh/unit of GDP (constant 2005 US$) : Gross electricity consumption (TWh) : 1.6 23.0 14 716 1 135 0.08 1.8 La filière hydroélectrique a généré 699 GWh en 2012, en baisse de 13,6 % par rapport à 2011. La production devrait logiquement repartir à la hausse dès cette année grâce à la mise en service du barrage du Grand Poubara en septembre 2013 doté de quatre turbines de 40 MW. Il devient le barrage le plus puissant du pays devant ceux de Tchimbélé (68 MW) et de Kinguélé (57,6 MW). D’autres ouvrages sont en projet ou en cours de réalisation au Gabon. La Banque africaine de développement (BAD) a approuvé le 18 juillet 2012 un prêt concessionnel de 57,5 millions d’euros pour le projet hydroélectrique Coder. Celui-ci prévoit la construction de deux nouvelles centrales pour un total de 152 MW. Le Gabon va probablement poursuivre son programme lancé en l’an 2000, visant à doter d’équipements solaires (microcentrales produisant en moyenne 450 kWh) les villages les plus reculés. Le pays compte aussi développer sa filière biomasse dont la production est actuellement limitée à 9 GWh, en profitant davantage des opportunités offertes par ses immenses ressources forestières. in September 2013 with its four 40 MW turbines. It will be the country’s most powerful dam after the Tchimbélé (68 MW) and Kinguélé (57,6 MW) Dams. Other major works are being planned or already under construction in Gabon. On 18 July 2012, the African Development Bank (AfDB) approved a senior loan of 57.5 million euros for the Coder hydroelectricity project to construct two new power plants with 152 MW of capacity between them. Gabon will probably continue its programme launched in 2000 to equip the most isolated villages with solar equipment (micro power plants with average output of 450 kWh). It is also banking on increasing exploitation of its immense expanses of forests to develop its biomass sector, whose output is just 9 GWh for the time being. Taux de croissance annuel moyen 2002-2012/Average annual growth rate 2002-2012 10 Biomasse/Biomass 0,5 % Hydraulique/Hydraulic 39,4 % Fossile/Fossil 60,1 % 5 0 -5 Biomasse/Biomass 2,5 % Hydraulique/Hydraulic -2,7 % Fossile/Fossil 7,0 % Taux de croissance 2011-2012/Growth rate 2011-2012 Structure de la production électrique d’origine renouvelable – 2012 Structure of electricity production from renewable energy sources – 2012 15 10 5 Biomasse/Biomass 1,3 % Hydraulique/Hydraulic 98,7 % 0 -5 -10 -15 304 Biomasse/Biomass 0,0 % Hydraulique/Hydraulic -13,6 % Fossile/Fossil 12,1 % 305 Copyright © 2013 – Observ’ER Quinzième inventaire – Édition 2013 Fifteenth inventory – 2013 edition 3. La production d’électricité d’origine renouvelable : détails par région et par pays Renewable origin electricity production: details by region and by country Production électrique par source/Electricity production by source tcam/aagr 02/12 tc/gr 11/12 TWh 2002 2009 2010 2011 2012 Géothermie/Geothermal - - - - - - Éolien/Wind - - - - - - - Biomasse/Biomass 0,007 0,008 0,009 0,009 0,009 2,5 % 0,0 % dont biomasse solide/solid biomass share 0,007 0,008 0,009 0,009 0,009 2,5 % 0,0 % dont biogaz/biogas share - - - - - - - dont biomasse liquide/liquid biomass share - - - - - - - dont déchets municipaux/municipal waste share - - - - - - - Déchets non renouvelables/ Non-renewable waste - - - - - - - dont déchets industriels/industrial waste share - - - - - - - dont déchets municipaux/municipal waste share - - - - - - - Solaire/Solar - - - - - - - dont photovoltaïque/photovoltaic share - - - - - - - dont thermodynamique/CSP share - - - - - - - Hydraulique/Hydraulic 0,923 0,886 0,809 0,809 0,699 -2,7 % -13,6 % dont pompage-turbinage/pumped-storage share - - - - - - - Énergies marines/Marine energies - - - - - - - Nucléaire/Nuclear - - - - - - - Fossile/Fossil 0,540 0,970 1,035 0,951 1,066 7,0 % 12,1 % Tot. renouvelable/renewable 0,930 0,894 0,818 0,818 0,708 -2,7 % -13,4 % Tot. conventionnelle/conventional 0,540 0,970 1,035 0,951 1,066 7,0 % 12,1 % Total production 1,5 1,9 % 0,3 % Part renouvelable/Renewable share 63,3 % 1,9 1,9 1,8 1,8 48,0 % 44,1 % 46,2 % 39,9 % - 306 307 Copyright © 2013 – Observ’ER


