Career Relief Pitching
Anuncio

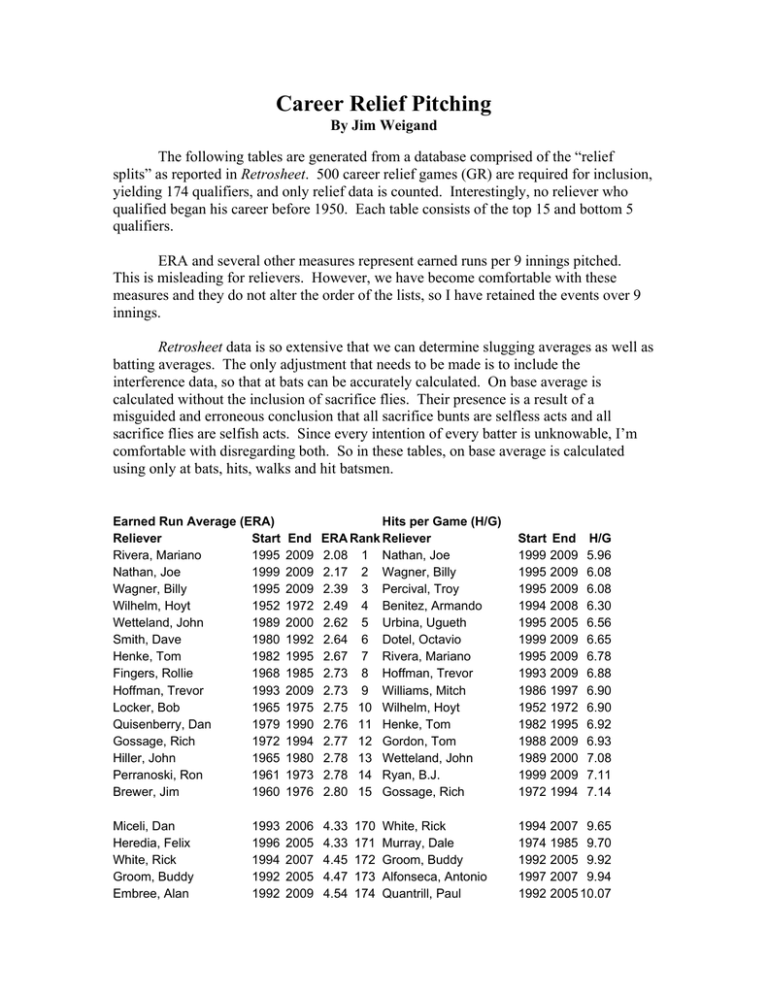
Career Relief Pitching By Jim Weigand The following tables are generated from a database comprised of the “relief splits” as reported in Retrosheet. 500 career relief games (GR) are required for inclusion, yielding 174 qualifiers, and only relief data is counted. Interestingly, no reliever who qualified began his career before 1950. Each table consists of the top 15 and bottom 5 qualifiers. ERA and several other measures represent earned runs per 9 innings pitched. This is misleading for relievers. However, we have become comfortable with these measures and they do not alter the order of the lists, so I have retained the events over 9 innings. Retrosheet data is so extensive that we can determine slugging averages as well as batting averages. The only adjustment that needs to be made is to include the interference data, so that at bats can be accurately calculated. On base average is calculated without the inclusion of sacrifice flies. Their presence is a result of a misguided and erroneous conclusion that all sacrifice bunts are selfless acts and all sacrifice flies are selfish acts. Since every intention of every batter is unknowable, I’m comfortable with disregarding both. So in these tables, on base average is calculated using only at bats, hits, walks and hit batsmen. Earned Run Average (ERA) Reliever Start Rivera, Mariano 1995 Nathan, Joe 1999 Wagner, Billy 1995 Wilhelm, Hoyt 1952 Wetteland, John 1989 Smith, Dave 1980 Henke, Tom 1982 Fingers, Rollie 1968 Hoffman, Trevor 1993 Locker, Bob 1965 Quisenberry, Dan 1979 Gossage, Rich 1972 Hiller, John 1965 Perranoski, Ron 1961 Brewer, Jim 1960 Miceli, Dan Heredia, Felix White, Rick Groom, Buddy Embree, Alan 1993 1996 1994 1992 1992 End 2009 2009 2009 1972 2000 1992 1995 1985 2009 1975 1990 1994 1980 1973 1976 Hits per Game (H/G) ERA Rank Reliever 2.08 1 Nathan, Joe 2.17 2 Wagner, Billy 2.39 3 Percival, Troy 2.49 4 Benitez, Armando 2.62 5 Urbina, Ugueth 2.64 6 Dotel, Octavio 2.67 7 Rivera, Mariano 2.73 8 Hoffman, Trevor 2.73 9 Williams, Mitch 2.75 10 Wilhelm, Hoyt 2.76 11 Henke, Tom 2.77 12 Gordon, Tom 2.78 13 Wetteland, John 2.78 14 Ryan, B.J. 2.80 15 Gossage, Rich Start End 1999 2009 1995 2009 1995 2009 1994 2008 1995 2005 1999 2009 1995 2009 1993 2009 1986 1997 1952 1972 1982 1995 1988 2009 1989 2000 1999 2009 1972 1994 2006 2005 2007 2005 2009 4.33 4.33 4.45 4.47 4.54 1994 1974 1992 1997 1992 170 171 172 173 174 White, Rick Murray, Dale Groom, Buddy Alfonseca, Antonio Quantrill, Paul H/G 5.96 6.08 6.08 6.30 6.56 6.65 6.78 6.88 6.90 6.90 6.92 6.93 7.08 7.11 7.14 2007 9.65 1985 9.70 2005 9.92 2007 9.94 2005 10.07 Walks per Game (BB/G) Reliever Start Quisenberry, Dan 1979 Eckersley, Dennis 1975 Jones, Doug 1982 Rivera, Mariano 1995 Foulke, Keith 1997 Borbon, Pedro Sr 1969 Beck, Rod 1991 Walker, Jamie 1997 Shaw, Jeff 1990 Face, Roy 1953 Bradford, Chad 1998 Quantrill, Paul 1992 Hoffman, Trevor 1993 Reed, Ron 1966 Fingers, Rollie 1968 End BB/G 1990 1.40 1998 1.40 2000 1.98 2009 2.04 2008 2.15 1980 2.20 2004 2.24 2009 2.25 2001 2.32 1969 2.32 2009 2.39 2005 2.41 2009 2.49 1984 2.54 1985 2.56 Rk 1 2 3 4 5 6 7 8 9 10 11 12 13 14 15 Strikeouts per Game (SO/G) Reliever Start End SO/G Lidge, Brad 2002 2009 12.15 Wagner, Billy 1995 2009 11.79 Dotel, Octavio 1999 2009 11.68 Urbina, Ugueth 1995 2005 11.03 Benitez, Armando 1994 2008 10.93 Nathan, Joe 1999 2009 10.73 Ryan, B.J. 1999 2009 10.48 Nen, Robb 1993 2002 10.06 Farnsworth, Kyle 1999 2009 9.94 Percival, Troy 1995 2009 9.91 Henke, Tom 1982 1995 9.81 Gordon, Tom 1988 2009 9.72 Marte, Damaso 1999 2009 9.65 Wetteland, John 1989 2000 9.62 Rhodes, Arthur 1991 2009 9.58 Reyes, Dennys Villone, Ron Slocumb, Heathcliff Romero, J.C. Williams, Mitch 2009 2009 2000 2009 1997 170 171 172 173 174 Murray, Dale Linzy, Frank Minton, Greg Borbon, Pedro Sr Quisenberry, Dan 1985 1974 1990 1980 1990 3.98 3.94 3.81 3.60 3.27 SA .281 .293 .299 .303 .315 .318 .319 .320 .323 .323 .323 .324 .324 .326 .326 .417 .420 .422 .430 .442 1997 1995 1991 1999 1986 5.01 5.07 5.11 5.20 7.10 1974 1963 1975 1969 1979 Batting Average (BA) Reliever Nathan, Joe Percival, Troy Wagner, Billy Benitez, Armando Urbina, Ugueth Dotel, Octavio Rivera, Mariano Hoffman, Trevor Gordon, Tom Henke, Tom Wilhelm, Hoyt Wetteland, John Ryan, B.J. Williams, Mitch Isringhausen, Jason Start End 1999 2009 1995 2009 1995 2009 1994 2008 1995 2005 1999 2009 1995 2009 1993 2009 1988 2009 1982 1995 1952 1972 1989 2000 1999 2009 1986 1997 1995 2009 BA .186 .188 .189 .195 .200 .204 .206 .208 .211 .211 .231 .214 .216 .216 .216 Rk 1 2 3 4 5 6 7 8 9 10 11 12 13 14 15 Slugging Average (SA) Reliever Start End Rivera, Mariano 1995 2009 Nathan, Joe 1999 2009 Wagner, Billy 1995 2009 Wilhelm, Hoyt 1952 1972 Abernathy, Ted 1955 1972 Ryan, B.J. 1999 2009 Gossage, Rich 1972 1994 Forster, Terry 1971 1986 Smith, Dave 1980 1992 Locker, Bob 1965 1975 Gordon, Tom 1988 2009 Isringhausen, Jason 1995 2009 Perranoski, Ron 1961 1973 Henke, Tom 1982 1995 McMahon, Don 1957 1974 Borbon, Pedro Sr Groom, Buddy Murray, Dale Alfonseca, Antonio Quantrill, Paul 1969 1992 1974 1997 1992 .279 .281 .281 .284 .288 170 171 172 173 174 Vizcaino, Luis Herges, Matt Speier, Justin White, Rick Walker, Jamie 1980 2005 1985 2007 2005 1999 1999 1998 1994 1997 2009 2009 2009 2007 2009 On Base Average (OBA) Reliever Start Nathan, Joe 1999 Rivera, Mariano 1995 Eckersley, Dennis 1975 Wagner, Billy 1995 Hoffman, Trevor 1993 Foulke, Keith 1997 Henke, Tom 1982 Wetteland, John 1989 Percival, Troy 1995 Urbina, Ugueth 1995 Wilhelm, Hoyt 1952 Sutter, Bruce 1976 Fingers, Rollie 1968 Fisher, Eddie 1959 Reed, Ron 1966 Rk 1 2 3 4 5 6 7 8 9 10 11 12 13 14 15 On Base plus Slugging (OPS) Reliever Start End Rivera, Mariano 1995 2009 Nathan, Joe 1999 2009 Wagner, Billy 1995 2009 Wilhelm, Hoyt 1952 1972 Hoffman, Trevor 1993 2009 Henke, Tom 1982 1995 Percival, Troy 1995 2009 Eckersley, Dennis 1975 1998 Gordon, Tom 1988 2009 Fingers, Rollie 1968 1985 Wetteland, John 1989 2000 Gossage, Rich 1972 1994 Locker, Bob 1965 1975 Smith, Dave 1980 1992 Isringhausen, Jason 1995 2009 End 2009 2009 1998 2009 2009 2008 1995 2000 2009 2005 1972 1988 1985 1973 1984 OBA .257 .259 .261 .265 .265 .275 .278 .281 .282 .287 .288 .289 .291 .292 .294 OPS .540 .550 .564 .591 .600 .603 .610 .613 .679 .621 .621 .623 .624 .625 .627 Villone, Ron DeJean, Mike Alfonseca, Antonio Slocumb, Heathcliff Williams, Mitch 2009 2006 2007 2000 1997 .353 .357 .357 .363 .370 170 171 172 173 174 Groom, Buddy Herges, Matt Alfonseca, Antonio DeJean, Mike White, Rick .759 .764 .767 .768 .772 Game Finished Percentage (GF%) Reliever Start End GF% Wetteland, John 1989 2000 87.02 Aguilera, Rick 1985 2000 86.63 Nen, Robb 1993 2002 85.92 Henke, Tom 1982 1995 85.36 Rivera, Mariano 1995 2009 85.34 Hoffman, Trevor 1993 2009 83.25 Isringhausen, Jason 1995 2009 82.07 Quisenberry, Dan 1979 1990 82.05 Wagner, Billy 1995 2009 81.71 Eckersley, Dennis 1975 1998 81.27 Smith, Lee 1980 1997 79.04 Reardon, Jeff 1979 1994 78.98 Montgomery, Jeff 1987 1999 78.54 Marshall, Mike 1967 1981 78.43 Fingers, Rollie 1968 1985 78.17 Rk 1 2 3 4 5 6 7 8 9 10 11 12 13 14 15 Save Percentage (SV%) Reliever Start End SV% Hoffman, Trevor 1993 2009 60.00 Rivera, Mariano 1995 2009 57.99 Eckersley, Dennis 1975 1998 54.93 Wetteland, John 1989 2000 54.91 Isringhausen, Jason 1995 2009 51.49 Percival, Troy 1995 2009 51.00 Aguilera, Rick 1985 2000 49.46 Wagner, Billy 1995 2009 49.23 Nen, Robb 1993 2002 49.14 Nathan, Joe 1999 2009 49.01 Myers, Randy 1985 1998 48.46 Henke, Tom 1982 1995 48.44 Smith, Lee 1980 1997 47.05 Sutter, Bruce 1976 1988 45.39 Montgomery, Jeff 1987 1999 43.49 Romero, J.C. Reyes, Dennys Eyre, Scott Cormier, Rheal King, Ray 170 171 172 173 174 Romero, J.C. Eyre, Scott Reyes, Dennys Cormier, Rheal King, Ray 1995 1997 1997 1991 1986 1999 1997 1997 1991 1999 2009 19.05 2009 18.77 2009 18.29 2007 18.26 2008 16.36 1992 1999 1997 1997 1994 1999 1997 1997 1991 1999 2005 2009 2007 2006 2007 2009 2009 2009 2007 2008 0.73 0.68 0.53 0.35 0.34 Home Runs per Game (HR/G) Reliever Start End HR/G Minton, Greg 1975 1990 .35 Perranoski, Ron 1961 1973 .37 Murray, Dale 1974 1985 .37 Forster, Terry 1971 1986 .38 Smith, Dave 1980 1992 .38 Linzy, Frank 1963 1974 .39 Tekulve, Kent 1974 1989 .39 Locker, Bob 1965 1975 .41 Lavelle, Gary 1974 1987 .42 McDowell, Roger 1985 1996 .42 Carroll, Clay 1964 1978 .43 Agosto, Juan 1981 1993 .43 Rivera, Mariano 1995 2009 .45 Miller, Bob 1957 1974 .46 Eichhorn, Mark 1982 1996 .48 Springer, Russ Vizcaino, Luis Guardado, Eddie Speier, Justin Walker, Jamie 1992 1999 1993 1998 1997 2009 2009 2009 2009 2009 1.20 1.30 1.31 1.44 1.48 Rk 1 2 3 4 5 6 7 8 9 10 11 12 13 14 15 Won Lost Percentage (Pct.) Reliever Start End Nathan, Joe 1999 2009 Jackson, Grant 1965 1982 Borbon, Pedro Sr 1969 1980 Hrabosky, Al 1970 1982 Cook, Dennis 1988 2002 Romero, J.C. 1999 2009 Radinsky, Scott 1990 2001 Leskanic, Curt 1993 2004 Heredia, Felix 1996 2005 Brocail, Doug 1992 2009 Powell, Jay 1995 2005 Rhodes, Arthur 1991 2009 Plunk, Eric 1986 1999 Miller, Trever 1996 2009 Burgmeier, Tom 1968 1984 Pct. .667 .653 .651 .646 .642 .630 .627 .623 .622 .613 .610 .608 .600 .600 .598 170 171 172 173 174 Myers, Randy Fossas, Tony Shaw, Jeff Davis, Mark Farnsworth, Kyle .424 .415 .405 .405 .373 1985 1988 1990 1980 1999 1998 1999 2001 1997 2009 I have avoided coming up with an overriding measurement for relief pitchers. Condensing this data into one number per reliever would be attractive, but subjective. However, a good argument can be made for Mariano Rivera being the best reliever in baseball history. He finished out of the top fifteen in only two categories and out of the top seven in only three: Category ERA H/G BB/G SO/G Rank 1 7 4 32 Category BA SA OBA OPS Rank 7 1 2 1 Category GF% SV% HR/G Pct. Rank 5 2 13 23
