Life expectancy at birth - Instituto Nacional de Estadistica.
Anuncio
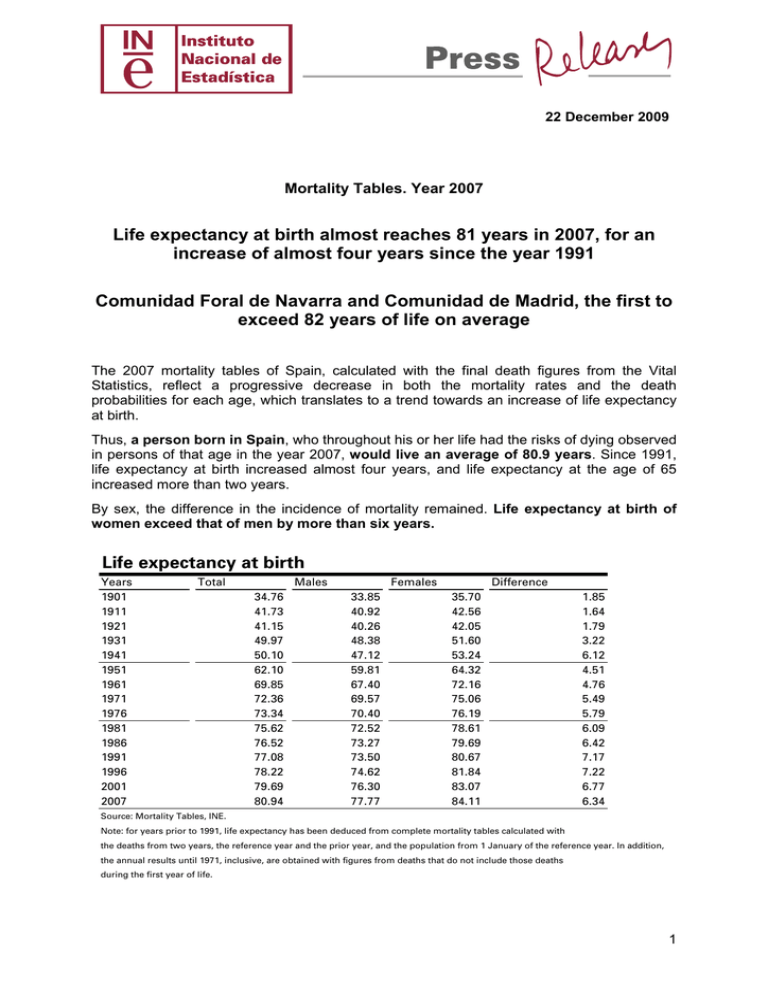
22 December 2009 Mortality Tables. Year 2007 Life expectancy at birth almost reaches 81 years in 2007, for an increase of almost four years since the year 1991 Comunidad Foral de Navarra and Comunidad de Madrid, the first to exceed 82 years of life on average The 2007 mortality tables of Spain, calculated with the final death figures from the Vital Statistics, reflect a progressive decrease in both the mortality rates and the death probabilities for each age, which translates to a trend towards an increase of life expectancy at birth. Thus, a person born in Spain, who throughout his or her life had the risks of dying observed in persons of that age in the year 2007, would live an average of 80.9 years. Since 1991, life expectancy at birth increased almost four years, and life expectancy at the age of 65 increased more than two years. By sex, the difference in the incidence of mortality remained. Life expectancy at birth of women exceed that of men by more than six years. Life expectancy at birth Years 1901 1911 1921 1931 1941 1951 1961 1971 1976 1981 1986 1991 1996 2001 2007 Total Males 34.76 41.73 41.15 49.97 50.10 62.10 69.85 72.36 73.34 75.62 76.52 77.08 78.22 79.69 80.94 Females 33.85 40.92 40.26 48.38 47.12 59.81 67.40 69.57 70.40 72.52 73.27 73.50 74.62 76.30 77.77 Difference 35.70 42.56 42.05 51.60 53.24 64.32 72.16 75.06 76.19 78.61 79.69 80.67 81.84 83.07 84.11 1.85 1.64 1.79 3.22 6.12 4.51 4.76 5.49 5.79 6.09 6.42 7.17 7.22 6.77 6.34 Source: Mortality Tables, INE. Note: for years prior to 1991, life expectancy has been deduced from complete mortality tables calculated with the deaths from two years, the reference year and the prior year, and the population from 1 January of the reference year. In addition, the annual results until 1971, inclusive, are obtained with figures from deaths that do not include those deaths during the first year of life. 1 Since 2001, life expectancy grew at an annual rate of 0.2 years. The growth rate was lower than that of previous periods, because the decrease in the incidence of mortality was essentially concentrated in the eldest ages, and therefore, its effect on life expectancy was not very significant. Life expectancy at birth for each sex 85.00 75.00 65.00 55.00 45.00 35.00 25.00 1901 1911 1921 1931 1941 1946 1951 1961 1971 1981 1991 2001 2007 Males Females Evolution of mortality by age Mortality tended to decrease for all ages. As compared with the progressive reduction of mortality in young adult ages throughout the decade of the 90s, above all in the bracket aged 18 to 35 years old, especially among men, in the first years of the 21st century, the most significant improvements moved towards the eldest ages, slowing the growth of life expectancy at birth, as commented above. In addition, since 1991, the life expectancy of women and men 65 years old increased 2.4 and 2.1 years, respectively. Life expectancy by sex, at different ages, between 1991 and 2007 Ages 1991 Males 0 1 15 40 65 75 85 95 2001 Males Females 2007 Males Females Females 73.50 80.67 76.30 83.07 77.77 84.11 73.09 80.19 75.63 82.38 77.06 83.38 59.38 66.43 61.82 68.53 63.21 69.51 36.38 42.15 38.05 44.05 39.11 44.91 15.60 19.25 16.85 20.85 17.68 21.65 9.35 11.38 10.21 12.66 10.75 13.24 5.02 5.72 5.45 6.40 5.74 6.66 2.77 2.94 3.08 3.14 3.07 3.12 Source: Mortality Tables, INE. Infant mortality, measured in terms of the risk of death during the first year of life, decreased from 7.2 deaths of children under 1 year of age per 1,000 births in 1991, to 3.5 deaths in 2007. Nevertheless, in recent years, the improvement rate of said indicator slowed, given the low levels already reached. 2 By sex, infant mortality remained higher in boys than in girls, with 3.7 deaths of boys under 1 year of age per 1,000 boys born, as compared with 3.3 deaths of girls, in 2007. Infant mortality Years Both sexes 1991 1992 1993 1994 1995 1996 1997 1998 1999 2000 2001 2002 2003 2004 2005 2006 2007 Boys Girls 7.20 7.05 6.58 5.89 5.41 5.49 5.04 4.77 4.50 4.42 4.02 4.12 3.97 4.00 3.79 3.62 3.52 7.94 7.76 7.27 6.53 5.76 6.24 5.53 5.15 4.84 4.70 4.35 4.57 4.29 4.42 4.24 4.05 3.74 6.42 6.29 5.85 5.21 5.03 4.69 4.52 4.36 4.14 4.11 3.68 3.64 3.64 3.55 3.32 3.16 3.28 Source: Mortality Tables, INE. Note: risk of death expressed in so many per thousand. Infant mortality 9 8 7 6 5 4 6 5 4 3 2 1 0 9 8 7 6 5 4 3 2 7 20 0 20 0 20 0 20 0 20 0 20 0 20 0 20 0 19 9 19 9 19 9 19 9 19 9 19 9 19 9 19 9 19 9 1 3 Year Boys Girls Note: risk of death expressed in so many per thousand 3 Instituto Nacional de Estadística Mortality improves in all Autonomous Communities The detailed results obtained by Autonomous Community also showed a favourable evolution of mortality for each of them. Illes Balears, Comunidad de Madrid, País Vasco, Comunidad Foral de Navarra and Cataluña registered the greatest increase in this indicator since the year 1991, with an increase of more than four years. In the year 2007, Comunidad Foral de Navarra and Comunidad de Madrid presented the highest levels of life expectancy, in both cases above 82 years. Conversely, the regions with the lowest average levels of life were Ceuta (78.5), Andalucía (79.7), Melilla and Canarias (80.1) and Asturias (80.2). Life expectancy at birth, by Autonomous Community Autonomous Community National total Andalucía Aragón Asturias (Principado de) Balears (Illes) Canarias Cantabria Castilla y León Castilla-La Mancha Cataluña Comunitat Valenciana Extremadura Galicia Madrid (Comunidad de) Murcia (Región de) Navarra (Comunidad Foral de) País Vasco Rioja (La) Ceuta Melilla Life expectancy 1991 77.08 76.16 78.19 76.48 76.10 76.33 77.66 78.48 77.82 77.33 76.55 76.83 76.85 77.60 76.50 78.13 77.15 77.79 75.01 76.50 2001 2007 79.69 78.50 80.26 79.54 79.38 78.45 80.36 81.16 80.18 79.91 78.93 79.34 79.91 80.61 78.96 81.11 80.22 80.55 78.53 78.42 80.94 79.67 81.42 80.22 81.39 80.14 80.91 81.81 81.36 81.39 80.40 80.44 80.78 82.20 80.33 82.27 81.36 81.45 78.49 80.07 Source: Mortality Tables, INE. The improvement in life expectancy in each Autonomous Community was also observed for each one of the sexes and age brackets. Comunidad Foral de Navarra, Castilla y León and Comunidad de Madrid were the regions that maintained the most favourable behaviour regarding mortality at the eldest ages, reaching a life expectancy at 65 years of age greater than 22.5 years in the case of women, and 18.3 years in the case of men. 4 Life expectancy of males at different ages in 2007 Autonomous Communities National total Andalucía Aragón Principado de Asturias Illes Balears Canarias Cantabria Castilla y León Castilla-La Mancha Cataluña Comunitat Valenciana Extremadura Galicia Comunidad de Madrid Región de Murcia Comunidad Foral de Navarra País Vasco La Rioja Ceuta Melilla Ages 0 1 77.77 76.58 78.20 76.59 78.50 77.03 77.35 78.69 78.72 78.22 77.37 77.33 77.17 78.95 77.24 79.03 77.99 77.97 75.75 77.62 15 77.06 75.95 77.49 76.01 77.66 76.31 76.64 77.90 78.02 77.45 76.69 76.52 76.41 78.21 76.57 78.27 77.35 77.11 75.73 76.89 63.21 62.10 63.68 62.16 63.76 62.40 62.82 64.05 64.25 63.59 62.88 62.63 62.57 64.35 62.71 64.44 63.48 63.46 61.73 63.04 65 85 17.68 16.69 18.09 17.16 18.01 17.46 17.51 18.51 18.28 17.88 17.41 17.33 17.79 18.34 17.19 18.41 17.90 17.96 16.61 18.06 5.74 5.69 5.70 5.41 6.06 6.31 5.74 6.08 5.85 5.60 5.55 5.89 5.79 5.87 5.45 5.70 5.71 5.83 7.38 7.62 Source: Mortality Tables, INE. Life expectancy of females at different ages in 2007 Autonomous Communities National total Andalucía Aragón Principado de Asturias Illes Balears Canarias Cantabria Castilla y León Castilla-La Mancha Cataluña Comunitat Valenciana Extremadura Galicia Comunidad de Madrid Región de Murcia Comunidad Foral de Navarra País Vasco La Rioja Ceuta Melilla Ages 0 84.11 82.78 84.76 83.79 84.32 83.37 84.50 85.02 84.08 84.51 83.45 83.69 84.35 85.14 83.49 85.51 84.66 85.19 81.27 82.36 1 15 83.38 82.09 84.14 83.37 83.60 82.68 83.80 84.35 83.38 83.72 82.71 83.02 83.65 84.33 82.80 84.65 84.02 84.65 80.75 81.51 69.51 68.22 70.21 69.44 69.70 68.80 69.94 70.46 69.57 69.87 68.84 69.28 69.75 70.46 68.91 70.73 70.17 70.65 66.91 67.51 65 21.65 20.41 22.24 21.61 21.82 21.16 22.16 22.72 21.67 21.87 21.09 21.28 22.00 22.48 20.94 22.88 22.40 22.27 19.69 20.70 85 6.66 6.18 6.95 6.54 6.79 6.87 6.95 7.32 6.52 6.63 6.35 6.52 6.83 7.02 6.30 7.34 6.86 6.79 7.13 7.79 Source: Mortality Tables, INE. 5 Spain, among the countries with the highest life expectancy at birth in the EU Spain was among the countries with the highest life expectancy of the European Union (EU). In particular, females resident in Spain were amongst the longest-living of the twenty-seven, with 84.1 years of life expectancy. For males, Spain was surpassed only by Sweden, Italy, Cyprus and the Netherlands. Life expectancy at birth in the countries of the European Union Year 2007 EU TOTAL (*) Germany Austria Belgium Bulgaria Cyprus Denmark Slovakia Slovenia Spain Estonia Finland France (*) Greece Netherlands Hungary Ireland Italy (*) Latvia Lithuania Luxembourg Malta Poland Portugal United Kingdom (*) Czech Republic Rumania Sweden Males Females 75.84 82.00 77.41 82.67 77.47 83.10 77.06 82.60 69.49 76.65 77.84 82.22 76.17 80.59 70.59 78.44 74.68 82.04 77.77 84.11 67.23 78.84 75.96 83.12 77.29 84.37 77.07 81.83 78.12 82.54 69.38 77.76 77.40 82.07 78.50 84.20 65.76 76.46 64.85 77.23 76.66 82.21 77.53 82.19 70.96 79.78 75.93 82.23 78.79 81.68 73.75 80.22 69.71 76.86 79.02 83.09 Source: Eurostat. Spanish data from Mortality Tables, INE. (*) Results corresponding to the year 2006. Detailed and provincial results The provincial and remaining detailed results of the Mortality Tables may be viewed at: http://www.ine.es/jaxi/menu.do?type=pcaxis&path=%2Ft20%2Fp319a&file=inebase&L= For further information see INEbase-www.ine.es All press releases at: www.ine.es/prensa/prensa_en.htm Press office: Telephone numbers: 91 583 93 63 / 94 08 – Fax: 91 583 90 87 - [email protected] Information area: Telephone number: 91 583 91 00 – Fax: 91 583 91 58 – www.ine.es/infoine 6 Methodological note Due to the growing interest in the knowledge of our demographic evolution and its social and economic repercussions, the INE has carried out a methodological review in the calculation of the mortality tables of the population of Spain, which will henceforth be calculated annually. Annual mortality tables are presented, for each year from the 1991-2007 period, based on this new methodology, thus providing a homogeneous series of results for the recent period. A mortality table is a demographic analysis instrument that enables analysing the incidence of mortality during a given period of time, irregardless of the age structure of the population, which allows for establishing comparative analyses. This type of mortality table, known as a period or contemporaries mortality table, provides a transversal analysis tool of the phenomenon of mortality. To this end, the table is comprised of a set of biometric functions, which aim to describe the short-term behaviour of the phenomenon regarding the population under study during a specific period. Such functions simulate its incidence on a cohort or fictitious generation of individuals, throughout their lives subject to a pattern of mortality by age identical to that observed regarding the population studied during the period observed. The annual mortality tables calculated have the objective of describing the short-term behaviour of the mortality of the resident population, for each sex and for both sexes, in Spain, its Autonomous Communities and provinces. For said purpose, we use all of the statistical-demographic information available on the subject. Specifically, the mortality tables presented are calculated with the results of the deaths occurring in Spain each year, provided by the Vital Statistics, and of the figures of the population resident at 1 January of each year that the INE uses as a reference in all of its statistical production, comprised of the Intercensal Population Estimates for the years prior to 2002, and the Population Now Cast since said year. Lastly, we must warn that the mortality tables on a national level offer results that are broken down by simple age, whereas the results of the Autonomous and provincial mortality tables are provided broken down into five-year age groups, except for the ages of 0 and 1 year old. Reference date of the results: each year from the 1991-2007 period. Population scope: the population resident in Spain and in each of its Autonomous Communities and provinces. Territorial scope: Spain, Autonomous Communities and provinces. Breakdown variables: sex and age (five-year age group in the case of Autonomous Communities and provinces). 7

