Figure of merit of a europium type 1:2:3 superconductor compound
Anuncio
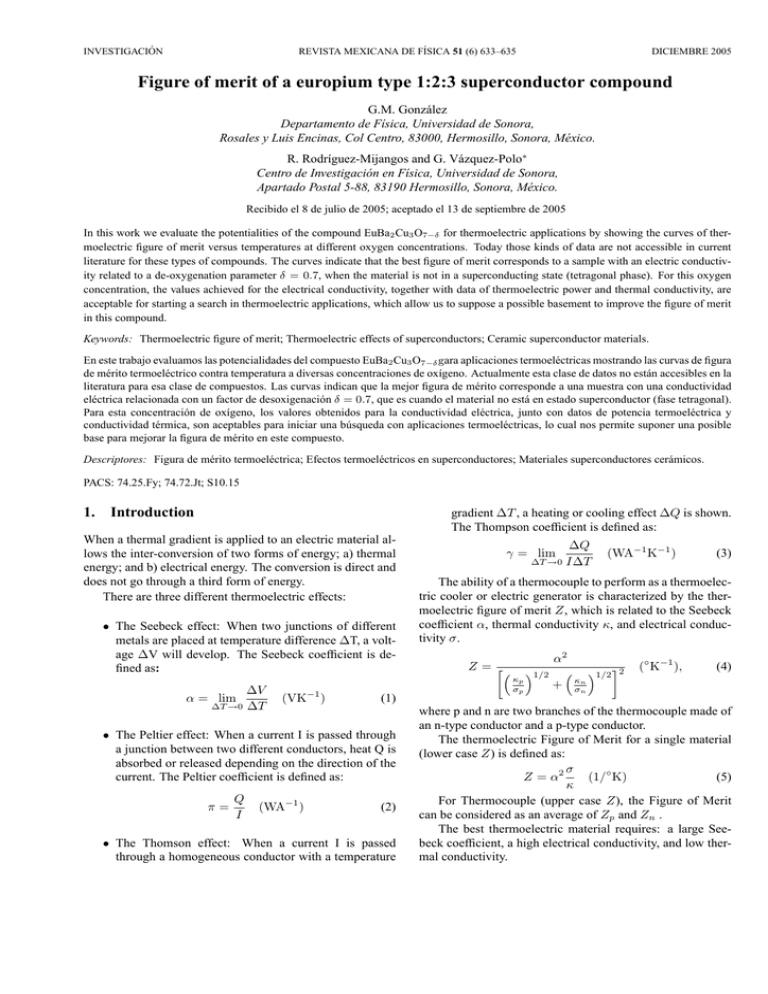
INVESTIGACIÓN REVISTA MEXICANA DE FÍSICA 51 (6) 633–635 DICIEMBRE 2005 Figure of merit of a europium type 1:2:3 superconductor compound G.M. González Departamento de Fı́sica, Universidad de Sonora, Rosales y Luis Encinas, Col Centro, 83000, Hermosillo, Sonora, México. R. Rodrı́guez-Mijangos and G. Vázquez-Polo∗ Centro de Investigación en Fı́sica, Universidad de Sonora, Apartado Postal 5-88, 83190 Hermosillo, Sonora, México. Recibido el 8 de julio de 2005; aceptado el 13 de septiembre de 2005 In this work we evaluate the potentialities of the compound EuBa2 Cu3 O7−δ for thermoelectric applications by showing the curves of thermoelectric figure of merit versus temperatures at different oxygen concentrations. Today those kinds of data are not accessible in current literature for these types of compounds. The curves indicate that the best figure of merit corresponds to a sample with an electric conductivity related to a de-oxygenation parameter δ = 0.7, when the material is not in a superconducting state (tetragonal phase). For this oxygen concentration, the values achieved for the electrical conductivity, together with data of thermoelectric power and thermal conductivity, are acceptable for starting a search in thermoelectric applications, which allow us to suppose a possible basement to improve the figure of merit in this compound. Keywords: Thermoelectric figure of merit; Thermoelectric effects of superconductors; Ceramic superconductor materials. En este trabajo evaluamos las potencialidades del compuesto EuBa2 Cu3 O7−δ gara aplicaciones termoeléctricas mostrando las curvas de figura de mérito termoeléctrico contra temperatura a diversas concentraciones de oxı́geno. Actualmente esta clase de datos no están accesibles en la literatura para esa clase de compuestos. Las curvas indican que la mejor figura de mérito corresponde a una muestra con una conductividad eléctrica relacionada con un factor de desoxigenación δ = 0.7, que es cuando el material no está en estado superconductor (fase tetragonal). Para esta concentración de oxı́geno, los valores obtenidos para la conductividad eléctrica, junto con datos de potencia termoeléctrica y conductividad térmica, son aceptables para iniciar una búsqueda con aplicaciones termoeléctricas, lo cual nos permite suponer una posible base para mejorar la figura de mérito en este compuesto. Descriptores: Figura de mérito termoeléctrica; Efectos termoeléctricos en superconductores; Materiales superconductores cerámicos. PACS: 74.25.Fy; 74.72.Jt; S10.15 1. gradient ∆T , a heating or cooling effect ∆Q is shown. The Thompson coefficient is defined as: Introduction When a thermal gradient is applied to an electric material allows the inter-conversion of two forms of energy; a) thermal energy; and b) electrical energy. The conversion is direct and does not go through a third form of energy. There are three different thermoelectric effects: • The Seebeck effect: When two junctions of different metals are placed at temperature difference ∆T, a voltage ∆V will develop. The Seebeck coefficient is defined as: α = lim ∆T →0 ∆V ∆T (VK−1 ) (1) • The Peltier effect: When a current I is passed through a junction between two different conductors, heat Q is absorbed or released depending on the direction of the current. The Peltier coefficient is defined as: π= Q I (WA−1 ) (2) • The Thomson effect: When a current I is passed through a homogeneous conductor with a temperature γ = lim ∆T →0 ∆Q I∆T (WA−1 K−1 ) (3) The ability of a thermocouple to perform as a thermoelectric cooler or electric generator is characterized by the thermoelectric figure of merit Z, which is related to the Seebeck coefficient α, thermal conductivity κ, and electrical conductivity σ. Z = ·³ α2 ´1/2 ³ ´1/2 ¸2 κp + κσnn σp (◦ K−1 ), (4) where p and n are two branches of the thermocouple made of an n-type conductor and a p-type conductor. The thermoelectric Figure of Merit for a single material (lower case Z) is defined as: σ (1/◦ K) (5) Z = α2 κ For Thermocouple (upper case Z), the Figure of Merit can be considered as an average of Zp and Zn . The best thermoelectric material requires: a large Seebeck coefficient, a high electrical conductivity, and low thermal conductivity. 634 G.M. GONZÁLEZ, R. RODRÍGUEZ-MIJANGOS, AND G. VÁZQUEZ-POLO One of the main thermoelectric applications is for refrigeration purposes and is called Peltier refrigerators. Bi2 Te3 is the thermoelectric material of choice for this application, ZT = 0.9 at room temperature; this is know as the thermoelectric effect. The ability of a material to perform as a thermoelectric cooler or electric generator is characterized by the thermoelectric figure of merit Z = (α2 σ/κ), where α is the Seebeck coefficient, or thermoelectric power, σ is the electrical conductivity, and κ is the thermal conductivity. In this figure of merit, the higher the Z value, the better the material. Higher values in the product of the squared thermoelectric power by the electrical conductivity, α2 σ, together with a lower value in the thermal conductivity, κ, gives a higher thermoelectric figure of merit. However, in superconductor materials, it happens that in the superconductor state, when σ is practicable infinity, α goes to zero. When the material is in the normal state, σ parameter takes on lower values and α grows. The κ goes like σ: higher values in the superconductor state and lower values in the normal state. Under these circumstances it must be necessary to optimize the combination of the three parameters in order to have the highest thermoelectric figure of merit parameter. After an exhaustive research over nearly a half-century, the best-known materials have been found to have a dimensionless figure of merit, ZT , value less than unity, where T is the temperature. Recently, however, several models have been developed which suggest that values substantially greater than unity may be attainable on real building materials [1]. As can be seen from the equation above, a material will have a high Z if it has a large Seebeck coefficient, high electrical conductivity and low thermal conductivity. Copper oxide superconductors seem to fit these characteristics by proper manipulation of the atomic stoichiometry of the compounds. Among the new materials developed during the last decade, the oxide compounds of the La2−X MX CuO4 family are promising candidates for thermoelectric conversion. In sintered samples, figures of merit greater than 10−4 K−1 have been obtained [2,3]. This is still a very low value, but this result could most probably be improved in other superconducting oxide families. From the results available in the literature [2], it is possible to estimate α2 /ρ to be higher than 3 × 10⁻⁴ Wm−1 K−2 for sintered samples of the YBa2 Cu3 O7−δ family, with δ in the range 0.65 to 0.75, while the thermal conductivity lies between 2 and 6 Wm−1 K−1 . The figure of merit calculated from these data, for the Y123 family, has no better values than those found for the La2−X MX CuO4 family, however the R123 compounds, where R = rare earth, are those kinds of materials for which it is possible to drastically modify the thermoelectric power, and thermal conductivity, by modifying the stoichiometry, and could be viewed as candidates for thermoelectric conversion. It would certainly be interesting to investigate the copper oxide materials in which supercon- ducting properties were not found. This lack of research into this kind of compound has motivated us to investigate the thermoelectric figure of merit as a function of temperature and oxygen-doping dependence in Eu123, as a first step in researching in this direction. It is interesting to discuss the thermoelectric Figure of Merit because there is very little information in the literature related to this kind of perovskite material. Recently, ceramic compounds have been studied as good thermoelectric materials [4,5], besides thermoelectric materials containing Europium have also been considered [6]. 2. Experimental The samples of EuBa2 Cu3 O7−δ were synthesized by the standard solid-state reaction procedure, a well mixed, ground powder of high purity reagents of Eu2 O3 , BaCO3 , and CuO, in the correct stoichiometry ratio. The samples were then oxygenated at different times, while maintaining diverse metastable-oxygen concentrations, 7-δ. The X-ray diffraction pattern of samples shows tetragonal structures for nonoxygenated or low-oxygenated samples and orthorhombic structures for medium and long term oxygenation samples, respectively. Oxygen content was obtained by the double titration method [7]. The analysis of powder diffraction pattern shows a transition orthorhombic-tetragonal at δ value of 0.55. Appropiate techniques for heat conductivity measurements are finding in Chaiking et al. [8], Reed et al. [9] and Berevelyi [10] The electric conductivity measurements were done in a closed-cycle low temperature refrigerator. The critical temperature in the samples was achieved by the four probe method for resistivity measurements, giving results that range from vanishing Tc for non-oxygenated samples to Tc = 91.2 K for the most oxygenated. 3. Results and conclusions In this work, the electrical conductivity parameter was measured in six polycrystalline samples of EuBa2 Cu3 O7−δ as a function of temperature and metastable oxygen on content. The de-oxygenation parameter δ was 0.04, 0.09, 0.15, 0.38, 0.55 and 0.69. All of these sample systems were superconductors, except the last one [11]. Figure 1 shows curves of electrical conductivity versus temperatures for several oxygen concentrations. We observed that the higher concentrations of oxygen, 1-δ, produce the higher electrical conductivity, whereas results previously reported [12] in the same samples show a maximum value of 140 µV/K for the thermoelectric power at a temperature around 250 K, which corresponds to a deoxygenating value of 0.7 and samples with less oxygen content have the highest thermoelectric power values. Rev. Mex. Fı́s. 51 (6) (2005) 633–635 FIGURE OF MERIT OF A EUROPIUM TYPE 1:2:3 SUPERCONDUCTOR COMPOUND 635 F IGURE 1. Electric conductivity versus temperature in samples of EuBa2 Cu3 O7−δ for several oxygen concentrations, 7 − δ. F IGURE 2. Figure of merit of EuBa2 Cu3 O7−δ for several oxygen concentrations, 7-δ, at low temperature. The thermal conductivity as a function of temperature and diverse oxygen content, measured in the same samples in previous work [11], shows that the lower oxygen concentrations produce the lowest thermal conductivity values, which helps to enhance the thermoelectric figure of merit. Finally, in Fig. 2, we show the figure of merit curves of EuBa2 Cu3 O7−δ as a function of temperature and oxygen content, which was obtained from the measured electrical conductivity, σ, of Fig. 1 in this paper, together with our previously reported experimental data [11,12] for α and κ. By examination of the dimensionless figure of merit curves, in Fig. 2, we can see that samples with less oxygen content have the best figure of merit. Though the thermoelectric figure of merit of the EuBa2 Cu3 O7−δg compound in general is still low compared to unity, further investigations on the non superconducting phase of this ceramic perovskite type compounds might reveal promising candidates for the Peltier cooling. As we know, electrical conductivity, thermoelectric power and thermal conductivity are very sensitive to the concentration of substituted atoms, oxygen in this case. Due to the latter behavior, it is possible to modify drastically the thermo physical properties of the samples by modifying the stoichiometry, i.e., doping with proper heavier atoms in the correct place must give a lower thermal conductivity. ∗ . Permanent address. Instituto de Fisica. UNAM. Apartado Postal 20-364, 01000, México, D.F. Acknowledgement We would like to express our grateful for the support of CONACYT MEXICO under grant 3548A. We are also grateful to Dr. R. Escamilla for several very useful discussions. Niihara, Junichi Hojo, Journal of American Ceramic Society 88 (2005) 628. 1. B.C. Sales, D. Mandrus, and R.K. Williams, Science 272 (1996) 1325. 6. Ya Mudryk et al., J Phys Cond Matter 14 (2002) 7991. 2. CRC Handbook of Thermoelectric, Chapter 30. D.M. Rowe, Edit., (CRC Press, NewYork 1995). 8. P.M. Chaikin and J.F. Kwak, Rev. Sci. Instrum. 46 (1975) 218. 3. M. Cassart and J.P. Issi, in proc. 8th International Conference on Thermoelectric Energy Conversion, Intitute National Polytechnique de Lorraine, Nancy, 121 (1989). 4. E. Iguchi, T. Itoga, H. Nakatsugawava, F. Munakata, and K. Furuya, J. Phys D; Appl Phys 34 (2001) 1017. 5. Kyoung Hun Him, Seung Hwan Shim, Kwang Bo Shim, Koichi 7. W.M. Chen et al., Physica C 270 (1996) 155. 9. R.P. Reed and A.F. Clark Editors; Materials at low temperatures, (Mc. Graw Hill 1978) Chapter 4. 10. D.T. Berevelyi, Rev. Sci. Instrum. 68 (1997) 2494. 11. G.M. González, R. Rodrı́guez Mijangos D.H. Galván, Phys. Stat. Sol. 184 (2001) 303. 12. G.M. González, R. Rodrı́guez-Mijangos, Journal of International Modern Physics B 13 (1999) 3663. Rev. Mex. Fı́s. 51 (6) (2005) 633–635
