modelo multiecuacional
Anuncio

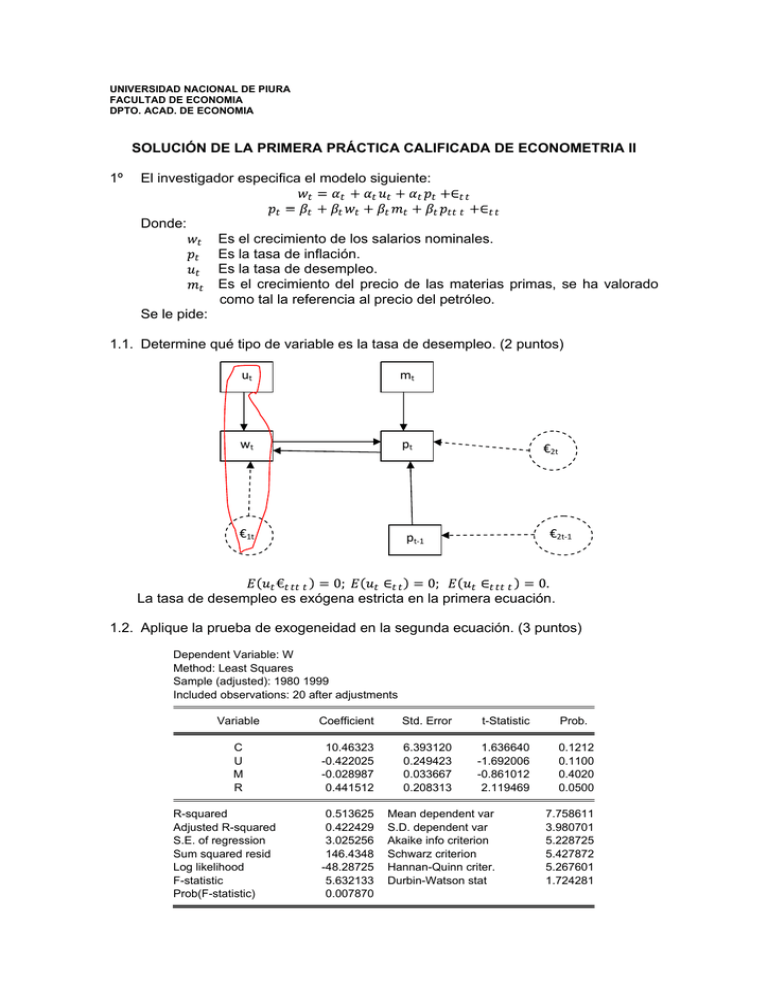
UNIVERSIDAD NACIONAL DE PIURA FACULTAD DE ECONOMIA DPTO. ACAD. DE ECONOMIA SOLUCIÄN DE LA PRIMERA PRÅCTICA CALIFICADA DE ECONOMETRIA II 1Ä El investigador especifica el modelo siguiente: Donde: Es el crecimiento de los salarios nominales. Es la tasa de inflaciÅn. Es la tasa de desempleo. Es el crecimiento del precio de las materias primas, se ha valorado como tal la referencia al precio del petrÅleo. Se le pide: 1.1. Determine quÇ tipo de variable es la tasa de desempleo. (2 puntos) ut mt wt pt €1t €2t €2t-1 pt-1 La tasa de desempleo es exÅgena estricta en la primera ecuaciÅn. 1.2. Aplique la prueba de exogeneidad en la segunda ecuaciÅn. (3 puntos) Dependent Variable: W Method: Least Squares Sample (adjusted): 1980 1999 Included observations: 20 after adjustments Variable Coefficient Std. Error t-Statistic Prob. C U M R 10.46323 -0.422025 -0.028987 0.441512 6.393120 0.249423 0.033667 0.208313 1.636640 -1.692006 -0.861012 2.119469 0.1212 0.1100 0.4020 0.0500 R-squared Adjusted R-squared S.E. of regression Sum squared resid Log likelihood F-statistic Prob(F-statistic) 0.513625 0.422429 3.025256 146.4348 -48.28725 5.632133 0.007870 Mean dependent var S.D. dependent var Akaike info criterion Schwarz criterion Hannan-Quinn criter. Durbin-Watson stat 7.758611 3.980701 5.228725 5.427872 5.267601 1.724281 2 1980 1985 1990 1995 12.21560 8.100807 10.82280 4.228913 Modified: 1970 2002 // frw.fit(f=na) wf 11.74926 10.58991 10.28851 5.888252 8.127680 6.992032 10.13459 8.640271 7.327393 5.123213 5.271588 3.471339 10.07206 8.814525 3.717374 3.596105 Dependent Variable: P Method: Least Squares Sample (adjusted): 1980 1999 Included observations: 20 after adjustments Variable Coefficient Std. Error t-Statistic Prob. C W M R WF -3.487888 0.575132 0.016400 0.073428 0.586212 1.398745 0.148303 0.018629 0.239562 0.380674 -2.493585 3.878075 0.880342 0.306511 1.539932 0.0248 0.0015 0.3926 0.7634 0.1444 R-squared Adjusted R-squared S.E. of regression Sum squared resid Log likelihood F-statistic Prob(F-statistic) 0.849878 0.809846 1.794624 48.31011 -37.19786 21.22970 0.000005 Mean dependent var S.D. dependent var Akaike info criterion Schwarz criterion Hannan-Quinn criter. Durbin-Watson stat 6.444500 4.115477 4.219786 4.468719 4.268380 1.058339 1.3. Verifique si la tasa de inflaciÅn es exÅgena fuerte. (3 puntos) ut mt wt pt €1t €2t pt-1 y la tasa de inflaciÅn precede al crecimiento de la tasa de salario, por lo tanto la tasa de inflaciÅn no es exÅgena fuerte en la primera ecuaciÅn. 2Ä El investigador corrige el modelo: Donde: Es el crecimiento del coste del uso del capital. Se le pide: 2.1. Estimar la primera ecuaciÅn por mÉnimos cuadrados bietÑpicos y verifique si los residuos son ruido blanco. (5 puntos) 3 Dependent Variable: W Method: Two-Stage Least Squares Sample (adjusted): 1980 1999 Included observations: 20 after adjustments Instrument list: C U M R Variable Coefficient Std. Error t-Statistic Prob. C U P 1.533198 0.039712 0.849292 4.835777 0.205056 0.191619 0.317053 0.193664 4.432204 0.7551 0.8487 0.0004 R-squared Adjusted R-squared S.E. of regression F-statistic Prob(F-statistic) 0.751371 0.722121 2.098396 17.36756 0.000078 Mean dependent var S.D. dependent var Sum squared resid Durbin-Watson stat Second-Stage SSR 7.758611 3.980701 74.85553 1.922400 148.1256 7 Series: Residuals Sample 1980 1999 Observations 20 6 5 4 3 2 1 Mean Median Maximum Minimum Std. Dev. Skewness Kurtosis -2.83e-16 -0.040835 5.191247 -3.503014 1.984884 0.700184 4.112914 Jarque-Bera Probability 2.666341 0.263640 0 -4 -3 -2 -1 0 1 2 3 4 5 6 Sample: 1980 1999 Included observations: 20 Autocorrelation . | . | ***| . | Partial Correlation AC . | . | ***| . | PAC 1 -0.046 -0.046 2 -0.388 -0.391 Q-Stat 0.0494 3.7225 Prob 0.824 0.155 Breusch-Godfrey Serial Correlation LM Test: Obs*R-squared 0.043407 Prob. Chi-Square(1) 0.8350 Breusch-Godfrey Serial Correlation LM Test: Obs*R-squared 3.242490 Prob. Chi-Square(2) 0.1977 Prob. F(2,17) Prob. Chi-Square(2) Prob. Chi-Square(2) 0.3728 0.3342 0.2915 Heteroskedasticity Test: White F-statistic Obs*R-squared Scaled explained SS 1.046381 2.192204 2.465222 4 Heteroskedasticity Test: White F-statistic Obs*R-squared Scaled explained SS 0.633707 3.691095 4.150786 Prob. F(5,14) Prob. Chi-Square(5) Prob. Chi-Square(5) 0.6776 0.5947 0.5279 Prob. F(1,17) Prob. Chi-Square(1) 0.8523 0.8418 Prob. F(2,15) Prob. Chi-Square(2) 0.6101 0.5633 Heteroskedasticity Test: ARCH F-statistic Obs*R-squared 0.035741 0.039862 Heteroskedasticity Test: ARCH F-statistic Obs*R-squared 0.510804 1.147758 Heteroskedasticity Test: Breusch-Pagan-Godfrey F-statistic Obs*R-squared Scaled explained SS 1.211177 2.494398 2.805051 Prob. F(2,17) Prob. Chi-Square(2) Prob. Chi-Square(2) 0.3223 0.2873 0.2460 Prob. F(2,17) Prob. Chi-Square(2) Prob. Chi-Square(2) 0.3405 0.3041 0.2613 Prob. F(1,18) Prob. Chi-Square(1) Prob. Chi-Square(1) 0.3239 0.2985 0.2633 Heteroskedasticity Test: Harvey F-statistic Obs*R-squared Scaled explained SS 1.148635 2.380927 2.683800 Heteroskedasticity Test: Glejser F-statistic Obs*R-squared Scaled explained SS 1.028515 1.081025 1.251367 Dependent Variable: ARESID Sample: 1980 1999 Included observations: 20 Variable Coefficient Std. Error t-Statistic Prob. C U 3.286724 -0.100936 1.910694 0.099527 1.720173 -1.014157 0.1025 0.3239 R-squared Adjusted R-squared S.E. of regression Sum squared resid Log likelihood F-statistic 0.054051 0.001499 1.395260 35.04150 -33.98678 1.028515 Mean dependent var S.D. dependent var Akaike info criterion Schwarz criterion Hannan-Quinn criter. Durbin-Watson stat 1.374987 1.396306 3.598678 3.698251 3.618115 2.053358 Heteroskedasticity Test: Glejser F-statistic Obs*R-squared Scaled explained SS 1.774109 1.794375 2.077122 Prob. F(1,18) Prob. Chi-Square(1) Prob. Chi-Square(1) 0.1995 0.1804 0.1495 5 Dependent Variable: ARESID Sample: 1980 1999 Included observations: 20 Variable Coefficient Std. Error t-Statistic Prob. C 1/U -0.734338 38.70846 1.612931 29.06135 -0.455282 1.331957 0.6544 0.1995 R-squared Adjusted R-squared S.E. of regression Sum squared resid Log likelihood F-statistic 0.089719 0.039148 1.368702 33.72024 -33.60243 1.774109 Mean dependent var S.D. dependent var Akaike info criterion Schwarz criterion Hannan-Quinn criter. Durbin-Watson stat 1.374987 1.396306 3.560243 3.659816 3.579681 2.126010 Heteroskedasticity Test: Glejser F-statistic Obs*R-squared Scaled explained SS 1.185205 1.235541 1.430230 Prob. F(1,18) Prob. Chi-Square(1) Prob. Chi-Square(1) 0.2907 0.2663 0.2317 Dependent Variable: ARESID Sample: 1980 1999 Included observations: 20 Variable Coefficient Std. Error t-Statistic Prob. C SQR(U) 5.327828 -0.911599 3.644155 0.837350 1.462020 -1.088671 0.1610 0.2907 R-squared Adjusted R-squared S.E. of regression Sum squared resid Log likelihood F-statistic 0.061777 0.009654 1.389550 34.75530 -33.90477 1.185205 Mean dependent var S.D. dependent var Akaike info criterion Schwarz criterion Hannan-Quinn criter. Durbin-Watson stat 1.374987 1.396306 3.590477 3.690050 3.609915 2.068178 Heteroskedasticity Test: Glejser F-statistic Obs*R-squared Scaled explained SS 1.561463 1.596469 1.848031 Prob. F(1,18) Prob. Chi-Square(1) Prob. Chi-Square(1) 0.2275 0.2064 0.1740 Dependent Variable: ARESID Sample: 1980 1999 Included observations: 20 Variable Coefficient Std. Error t-Statistic Prob. C 1/SQR(U) -2.783317 17.88942 3.341944 14.31628 -0.832844 1.249585 0.4158 0.2275 R-squared Adjusted R-squared S.E. of regression Sum squared resid Log likelihood F-statistic 0.079823 0.028703 1.376122 34.08680 -33.71055 1.561463 Mean dependent var S.D. dependent var Akaike info criterion Schwarz criterion Hannan-Quinn criter. Durbin-Watson stat 1.374987 1.396306 3.571055 3.670628 3.590493 2.104572 6 2.2. Determine el mÇtodo adecuado de estimaciÅn. (2 puntos) Covariance Analysis: Ordinary Sample (adjusted): 1980 1999 Included observations: 20 after adjustments Balanced sample (listwise missing value deletion) Correlation t-Statistic Probability RESID01 RESID02 W P 2Ä RESID01 1.000000 --------- RESID02 -0.988551 -27.79628 0.0000 1.000000 --------- W 1.000000 -0.988551 P -0.988551 1.000000 Comente y fundamente su respuesta. (5 puntos) 2.1. La prueba de Hausman permite establecer si un modelo presenta Endogeneidad. 2.2. La causalidad Granger se utiliza para establecer la exogeneidad.

