EJC 21 Multicolinealidad Consumo
Anuncio
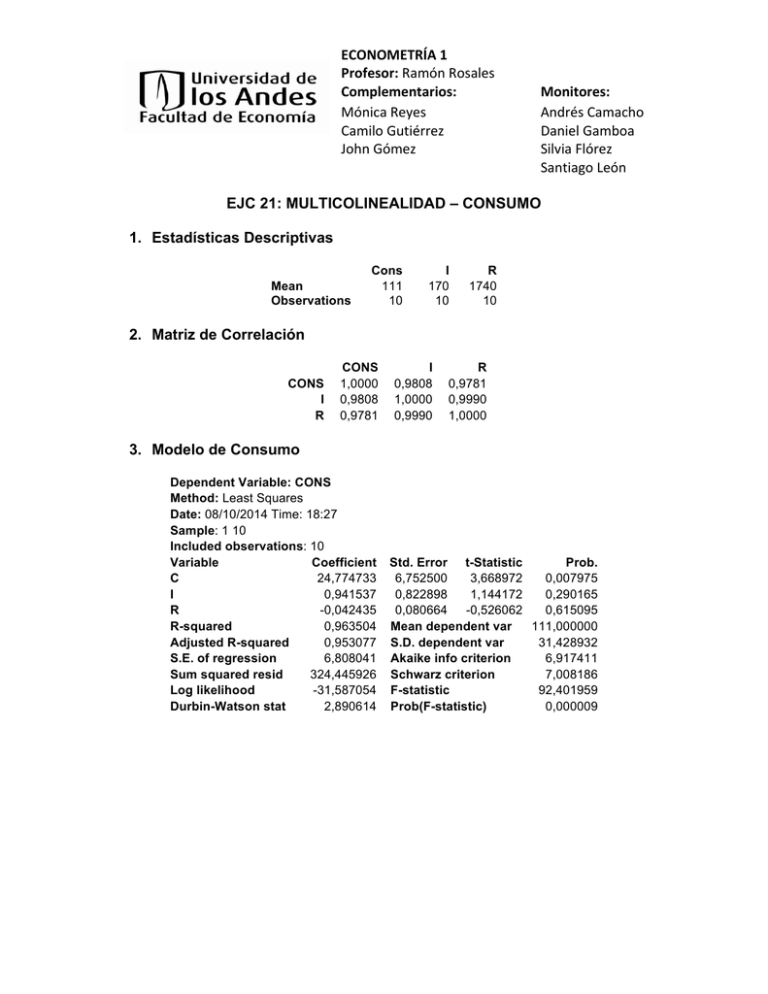
ECONOMETRÍA 1 Profesor: Ramón Rosales Complementarios: Mónica Reyes Camilo Gutiérrez John Gómez Monitores: Andrés Camacho Daniel Gamboa Silvia Flórez Santiago León EJC 21: MULTICOLINEALIDAD – CONSUMO 1. Estadísticas Descriptivas Mean Observations CONS 1,0000 0,9808 0,9781 R 1740 10 I 0,9808 1,0000 0,9990 R 0,9781 0,9990 1,0000 3. Modelo de Consumo Dependent Variable: CONS Method: Least Squares Date: 08/10/2014 Time: 18:27 Sample: 1 10 Included observations: 10 Variable Coefficient C 24,774733 I 0,941537 R -0,042435 R-squared 0,963504 Adjusted R-squared 0,953077 S.E. of regression 6,808041 Sum squared resid 324,445926 Log likelihood -31,587054 Durbin-Watson stat 2,890614 I 170 10 2. Matriz de Correlación CONS I R Cons 111 10 Std. Error t-Statistic Prob. 6,752500 3,668972 0,007975 0,822898 1,144172 0,290165 0,080664 -0,526062 0,615095 Mean dependent var 111,000000 S.D. dependent var 31,428932 Akaike info criterion 6,917411 Schwarz criterion 7,008186 F-statistic 92,401959 Prob(F-statistic) 0,000009 2 4. Matriz de varianza y covarianza de los coeficientes C I R C 45,59625084 0,261567763 -0,049096453 I 0,261567763 0,677161551 -0,066309788 R -0,049096453 -0,066309788 0,006506759 5. Regresiones auxiliares Dependent Variable: I Method: Least Squares Date: 08/10/2014 Time: 18:29 Sample: 1 10 Included observations: 10 Variable Coefficient Std. Error t-Statistic Prob. C -0,386271 2,897956 -0,133291 0,897255 R 0,097923 0,001578 62,040474 0,000000 R-squared 0,997926 Mean dependent var 170,000000 Adjusted R-squared 0,997667 S.D. dependent var 60,553007 S.E. of regression 2,925035 Akaike info criterion 5,161346 Sum squared resid 68,446618 Schwarz criterion 5,221863 Log likelihood -23,806731 F-statistic 3849,020369 Durbin-Watson stat 2,068509 Prob(F-statistic) 0,000000 Dependent Variable: R Method: Least Squares Date: 08/10/2014 Time: 18:31 Sample: 1 10 Included observations: 10 Variable Coefficient C 7,545455 I 10,190909 R-squared 0,997926 Adjusted R-squared 0,997667 S.E. of regression 29,839723 Sum squared resid 7123,272727 Log likelihood -47,032073 Durbin-Watson stat 2,077534 Std. Error t-Statistic Prob. 29,475811 0,255988 0,804419 0,164262 62,040474 0,000000 Mean dependent var 1740,000000 S.D. dependent var 617,731153 Akaike info criterion 9,806415 Schwarz criterion 9,866932 F-statistic 3849,020369 Prob(F-statistic) 0,000000
