accidentes laborales totales con baja según actividad
Anuncio

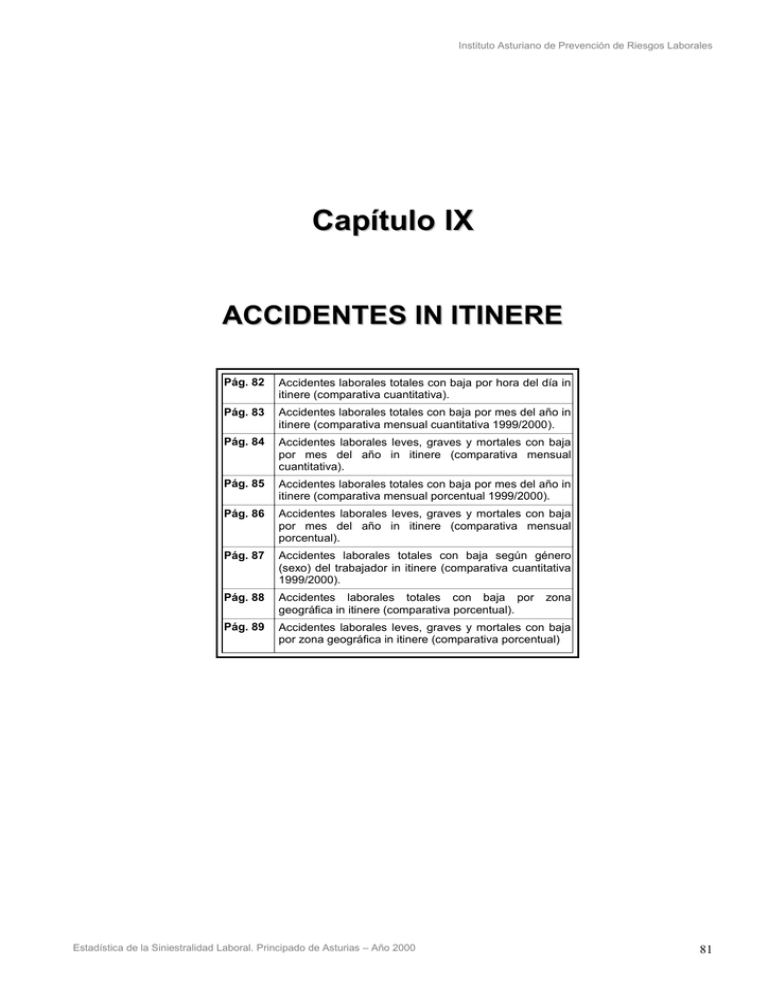
Instituto Asturiano de Prevención de Riesgos Laborales Capítulo IX ACCIDENTES IN ITINERE Pág. 82 Accidentes laborales totales con baja por hora del día in itinere (comparativa cuantitativa). Pág. 83 Accidentes laborales totales con baja por mes del año in itinere (comparativa mensual cuantitativa 1999/2000). Pág. 84 Accidentes laborales leves, graves y mortales con baja por mes del año in itinere (comparativa mensual cuantitativa). Pág. 85 Accidentes laborales totales con baja por mes del año in itinere (comparativa mensual porcentual 1999/2000). Pág. 86 Accidentes laborales leves, graves y mortales con baja por mes del año in itinere (comparativa mensual porcentual). Pág. 87 Accidentes laborales totales con baja según género (sexo) del trabajador in itinere (comparativa cuantitativa 1999/2000). Pág. 88 Accidentes laborales totales con baja por geográfica in itinere (comparativa porcentual). Pág. 89 Accidentes laborales leves, graves y mortales con baja por zona geográfica in itinere (comparativa porcentual) Estadística de la Siniestralidad Laboral. Principado de Asturias – Año 2000 zona 81 Instituto Asturiano de Prevención de Riesgos Laborales ACCIDENTES LABORALES TOTALES CON BAJA POR HORA DEL DIA EN 2000 (IN ITINERE) - Comparativa Cuantitativa TOTALES 128 112 105 83 69 64 57 1 10 00 01 2 4 4 02 03 04 28 29 24 46 25 12 47 36 32 24 21 8 1 11 05 06 07 08 09 10 11 12 13 14 15 16 17 18 19 20 21 22 23 24 ND LEVES 122 110 101 80 66 63 55 24 0 10 00 01 2 3 4 02 03 04 28 44 23 44 36 24 12 24 31 11 05 06 07 08 09 10 11 12 13 14 15 16 17 18 19 20 21 22 6 1 23 24 19 ND GRAVES 4 4 2 0 0 00 01 02 03 0 0 04 05 1 0 06 07 08 09 2 2 2 1 1 0 3 3 3 10 11 1 0 0 12 1 13 14 15 16 17 18 19 20 0 0 0 0 21 22 23 24 ND 0 0 0 0 22 23 24 ND MORTALES 2 2 2 1 00 1 1 0 0 0 0 0 0 01 02 03 04 05 06 07 0 0 08 09 10 0 0 0 11 12 13 14 0 0 0 15 16 17 1 0 18 19 20 21 * ND: No disponible Estadística de la Siniestralidad Laboral. Principado de Asturias – Año 2000 82 Instituto Asturiano de Prevención de Riesgos Laborales ACCIDENTES LABORALES TOTALES CON BAJA POR MES (IN ITINERE) - Comparativa Mensual Cuantitativa 1999/2000 - 110 120 101 97 100 87 68 60 75 68 Septiembre 78 76 Agosto 80 97 66 60 40 20 0 Diciembre Noviembre Octubre Estadística de la Siniestralidad Laboral. Principado de Asturias – Año 2000 Julio Junio Mayo Abril Marzo Febrero Enero 1999 2000 83 Instituto Asturiano de Prevención de Riesgos Laborales ACCIDENTES LABORALES LEVES, GRAVES Y MORTALES CON BAJA POR MES DEL AÑO 2000 (IN ITINERE) - Comparativa Mensual Cuantitativa 120 LEVES 100 80 107 94 92 75 65 59 92 73 86 71 64 60 65 40 20 0 Diciembre Noviembre Octubre Septiembre Agosto Julio Junio Mayo Abril Marzo Febrero Enero GRAVES 6 6 5 4 4 4 4 3 3 3 2 2 2 1 1 1 0 0 Diciembre Noviembre Octubre Septiembre Agosto Julio Junio Mayo Abril Marzo Febrero Enero 0 3 3 MORTALES 2 2 1 1 1 1 1 0 0 1 0 0 0 Diciembre Noviembre Octubre Septiembre Agosto Julio Junio Mayo Abril Marzo Febrero Enero Estadística de la Siniestralidad Laboral. Principado de Asturias – Año 2000 0 84 Instituto Asturiano de Prevención de Riesgos Laborales ACCIDENTES LABORALES TOTALES CON BAJA POR MES (IN ITINERE) - Comparativa Mensual Porcentual 1999/2000- 14 % 6,10 % 12 % 7,73 % 9,87 % 10,27 % 11,19 % 9,87 % 10 % 6,92 % 6,71 % 7,93 % 8,85 % 7,63 % 6,92 % 8% 6% 4% 2% 0% Enero Febrero Marzo Abril Mayo Estadística de la Siniestralidad Laboral. Principado de Asturias – Año 2000 Junio Julio Agosto Septiembre Octubre Noviembre Diciembre 1999 2000 85 Instituto Asturiano de Prevención de Riesgos Laborales ACCIDENTES LABORALES LEVES, GRAVES Y MORTALES CON BAJA POR MES DEL AÑO 2000 (IN ITINERE) - Comparativa Mensual Porcentual LEVES 12 % 9,76 % 10 % 11,35 % 9,97 % 7,95 % 6,89 % 9,76 % 6,26 % 8% 7,74 % 9,12 % 7,53 % 6,89 % 6,79 % 6% 4% 2% 0% Diciembre Noviembre Octubre Septiembre Agosto Julio Junio Mayo Abril Marzo Febrero Enero GRAVES 20,00 % 20 % 18 % 16 % 14 % 13,33 % 10,00 % 12 % 10 % 6,67 % 8% 13,33 % 13,33 % 10,00 % 6,67 % 3,33 % 6% 3,33 % 4% 2% 0% 0,00 % MORTALES Diciembre Noviembre Octubre Septiembre Agosto 30 % Julio Junio Mayo Abril Marzo Febrero Enero 0,00 % 30,00 % 25 % 20,00 % 20 % 15 % 10,00 % 10,00 % 10,00 % 10 % 10,00 % 0,00 % 0,00 % 10,00 % 5% 0,00 % 0,00 % 0,00 % 0% Diciembre Noviembre Octubre Septiembre Agosto Julio Junio Mayo Abril Marzo Febrero Enero Estadística de la Siniestralidad Laboral. Principado de Asturias – Año 2000 86 Instituto Asturiano de Prevención de Riesgos Laborales ACCIDENTES LABORALES CON BAJA SEGÚN EL GÉNERO (SEXO) DEL TRABAJADOR (IN ITINERE) - Comparativa Cuantitativa 1999/2000- 623 Varón 615 272 Mujer 368 0 200 400 600 800 Año 1999 Año 2000 Estadística de la Siniestralidad Laboral. Principado de Asturias – Año 2000 87 Instituto Asturiano de Prevención de Riesgos Laborales ACCIDENTES LABORALES TOTALES CON BAJA POR ZONA GEOGRÁFICA EN 2000 (IN ITINERE) - Comparativa Porcentual - Comarca de Avilés 11,39% Siero-Noreña-Llanera 11,80% Cuenca del Caudal 5,19% Cuenca del Nalón 6,00% Oviedo 26,35% Otros concejos 4,88% Gijón 26,04% Oriente 3,76% Estadística de la Siniestralidad Laboral. Principado de Asturias – Año 2000 Occidente 4,58% 88 Instituto Asturiano de Prevención de Riesgos Laborales ACCIDENTES LABORALES LEVES, GRAVES Y MORTALES CON BAJA POR ZONA GEOGRÁFICA EN 2000 (IN ITINERE) - Comparativa Porcentual - Siero-Noreña-Llanera 11,24% Comarca de Avilés 11,45% LEVES Cuenca del Caudal 5,41% Cuenca del Nalón 5,83% Oviedo 26,72% Otros concejos 4,67% Gijón 26,62% Oriente 3,71% Occidente 4,35% Comarca de Avilés 10,00% GRAVES Cuenca del Caudal 0,00% Siero-Noreña-Llanera 26,67% Cuenca del Nalón 13,33% Gijón 10,00% Oviedo 13,33% Occidente 10,00% Otros concejos 10,00% Oriente 6,67% MORTALES Comarca de Avilés 10,00% Siero-Noreña-Llanera 20,00% Gijón 20,00% Occidente 10,00% Oviedo 30,00% Otros concejos 10,00% Estadística de la Siniestralidad Laboral. Principado de Asturias – Año 2000 89 Instituto Asturiano de Prevención de Riesgos Laborales Estadística de la Siniestralidad Laboral. Principado de Asturias – Año 2000 90
