Cúmulos de Galaxias
Anuncio
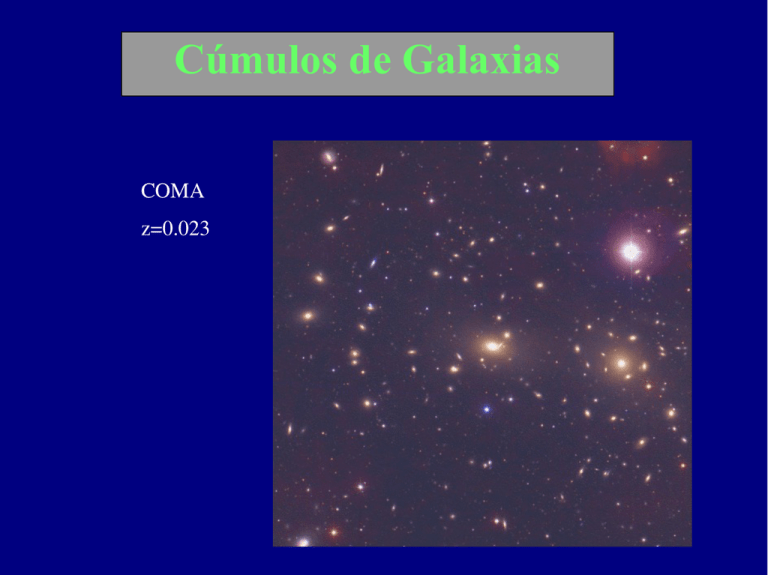
Cúmulos de Galaxias COMA z=0.023 RCS0439.6­2905 z=0.97 • • • Los objetos gravitacionalmente ligados más masivos en el universo (M~1015 M⊙ ), con dispersión de velocidad de 800 km s-1 Presentan emisión en rayos-X producida por gas caliente Definen un laboratorio natural para estudiar evolución de galaxias, el medio intergaláctico y la naturaleza de la materia oscura MOS Magellan Rayos X de Coma Rayos X de Coma T=88 x 106 K Cúmulo de Virgo X-ray distribución de galaxias • Para Virgo M = 1.5 - 5.5 x 10¹⁴ M⊙ , y la masa de la componente gaseosa – • Mg = 4 ­ 5.5 x 10¹³ M⊙ para cúmulos típicamente MT = 5 - 50 x 1014 M⊙, de las cuales 5% corresponde a la parte luminosa, i.e. galaxias 10-30% está en gas caliente el resto en otra forma de materia oscura The Red-Sequence Cluster Survey (RCS) z~1 clusters Felipe Barrientos (PUC, Chile) Collaboration Mike Gladders (OCIW) Howard Yee (U Toronto) David Gilbank (U Toronto) Erica Ellingson (U Colorado) Henk Hoekstra (U Victoria) A cluster survey based on the homogeneity of the colors of the early-type (E/S0) population seen at low and intermediate redshifts and present in all the clusters found to date. López-Cruz 1998 These systems have historically played a central role in observational cosmological. They have also being important in galaxy evolution, large scale structure and lensing studies. 90 sq deg area R and z band imaging R(AB) = 25.4 z(AB) = 23.9 Including HDFS XMM-LSS BOOMERANG CHANDRA DF The algorithm searches for overdensities in the x, y, color and mag space. 2.5 arcmin RCS0439.6-2905 z=0.951 i'JK composite seeing ~ 0.4'' Magellan + VLT RCS0439.6-2905 (central 0.5 Mpc) (J-K)=0.056 ± 0.014 (I-K)=0.108 ± 0.030 consistent with zf > 2 Morphology has been determined using a 2-D galaxy light Residuals Original Simetrized Bulge Disk Models B+D Size-magnitude relation Luminosity evolution... consistent with passive evolution HST clusters - Schade, Barrientos & Lopez-Cruz (1997) This is also consistent with the luminosity function K* = 18.37 ± 0.12 De Propris et al. 1999 Mask VLT-FORS2 11 objects in this cluster Spectrum for one of the brightest galaxies in RCS0439.6-2905 We have ~20 clusters to date at z~1 Cluster Bgc zest zspec Nz Nmem RCS0220.9­0333 760 0.920 1.026 16 6 RCS0221.7­0322 590 1.057 1.018 47 19 RCS0336.1­2733 750 0.925 0.942 24 5 RCS0350.8­1024 620 0.874 0.945 46 10 RCS0441.2­2858 570 1.037 0.952 16 5 RCS0517.0­4340 870 0.937 0.935 26 6 1010 1.073 1.100 47 7 RCS2112.4­6326 Status of the spectroscopic redshifts in the RCS We have practically doubled the number of known clusters at z>0.9 RCS0220.9-0333 z=1.026 1.3 Mpc Richness vs Velocity dispersion RCS2118.1-6354 z=0.858 10 members z<0.6 relation Blindert et al 2004 RCS0221.7-0322 z=1.018 19 members Composite z=1 cluster Composite z=1 cluster Richness vs Velocity dispersion Composite z=1 cluster Summary Spectroscopy for ~20 z~1 clusters average velocity dispersion ~800 km/s early results show they appear to fall on same richness -- velocity dispersion relation as z<0.6 clusters ~90% of RCS z~1 clusters are real 130 clusters in RCS1 catalogue with z>0.9 (Bgc>500, significance>3.3-sigma) RCS2 is coming (800 sq deg) First X-ray results (Hicks et al., 2003) Chandra ACIS observations of 6 clusters at 0.6 < z < 1.0; all detected! 15-50 Ksec exposures NOT a representative sample but still diverse- some with strong lensing, mix of rich and poorer, concentrated and diffuse Added 2 clusters from XMM-LSS; Neumann et al. 2003 Lensing clusters: RCS0224-0002 & RCS1419+5326 (z=0.78) (z=0.64) RCS1417+5305 and 0439-2905: z~1.0 Optical and X-ray images not same scale Lx versus Bgc (optical richness) Red = CNOC/EMSS z~0.35 Blue = XMM LSS Purple = RCS (0.6 < z < 1.0) RCS strong lenses= purple squares See also Donahue et al. 1999; Gilbank 2003– optical searches find candidates which are not X-ray luminous Lx versus Bgc calculated using only the red-sequence galaxies Red = CNOC/EMSS Blue = XMM LSS Purple = RCS RCS giant arcs= purple squares No bright arcs = Purple triangles Better correlation: blue galaxies in RCS clusters a poorer tracer of mass? Still discrepancies in several non-lensing clusters Otros proyectos que incluyen TODO el catálogo •Propiedades estelares de las galaxias •Medio interestelar de galaxias Función de luminosidad Utilizando un método estadístico Gilbank et al 2007 la línea segmentada es la función de luminosidad para bajo z, con evolución pasiva para otros z. Evolución de la razón # lum / # débil downsizing? Faltan modelos que predigan esta evolución Halos de galaxias en cúmulos Cúmulos de RCS QSOs de SDSS Redshift path del survey (z)
