CO2 EMISSIONS have been ON THE RISE in LATIN
Anuncio

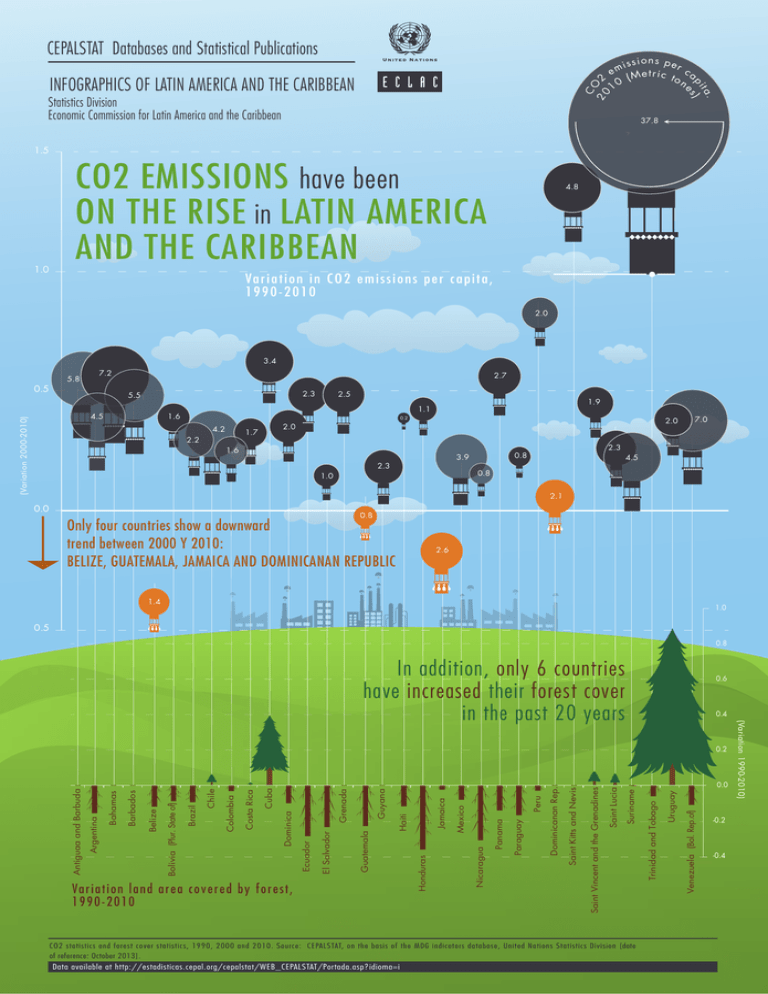
CEPALSTAT Databases and Statistical Publications CO 20 Statistics Division Economic Commission for Latin America and the Caribbean 10 ssions per c (Met r ic ton a . ta pi s) e 2 INFOGRAPHICS OF LATIN AMERICA AND THE CARIBBEAN i em 37.8 1.5 1.0 CO2 EMISSIONS have been ON THE RISE in LATIN AMERICA AND THE CARIBBEAN 4.8 2,52 Va r i a t i o n i n C O 2 e m i s s i o n s p e r c a p i t a , 1990-2010 2.0 3.4 0.5 5.8 7.2 2.7 2.3 5.5 3,11 (Variation 2000-2010) 4.5 2.5 1.9 1.1 1.6 1,71 7.0 2.0 2,88 0.2 4.2 2.0 1.7 2.2 1.6 2.3 2.3 0.8 3.9 4.5 0.8 1.0 2.1 0.0 0.8 Only four countries show a downward trend between 2000 Y 2010: BELIZE, GUATEMALA, JAMAICA AND DOMINICANAN REPUBLIC 2.6 1.4 1.0 0.5 0.8 In addition, only 6 countries have increased their forest cover in the past 20 years 0.6 0.4 CO2 statistics and forest cover statistics, 1990, 2000 and 2010. Source: CEPALSTAT, on the basis of the MDG indicators database, United Nations Statistics Division [date of reference: October 2013]. Data available at http://estadisticas.cepal.org/cepalstat/WEB_CEPALSTAT/Portada.asp?idioma=i Venezuela (Bol. Rep.of) Uruguay Trinidad and Tobago Suriname Saint Lucia Saint Vincent and the Grenadines Saint Kitts and Nevis Dominicanan Rep. Peru Paraguay Panama Nicaragua Mexico Jamaica Honduras Haiti Guyana Guatemala Grenada El Salvador Ecuador Dominica Cuba Costa Rica Colombia Chile Brazil Bolivia (Plur. State of) Belize Barbados Bahamas Argentina Antiguaa and Barbuda Var iatio n la nd a r ea c o vered by forest , 1 9 9 0 -2 0 1 0 0.0 -0.2 -0.4 (Variation 1990-2010) 0.2

