POTENCIA (MW)
Anuncio

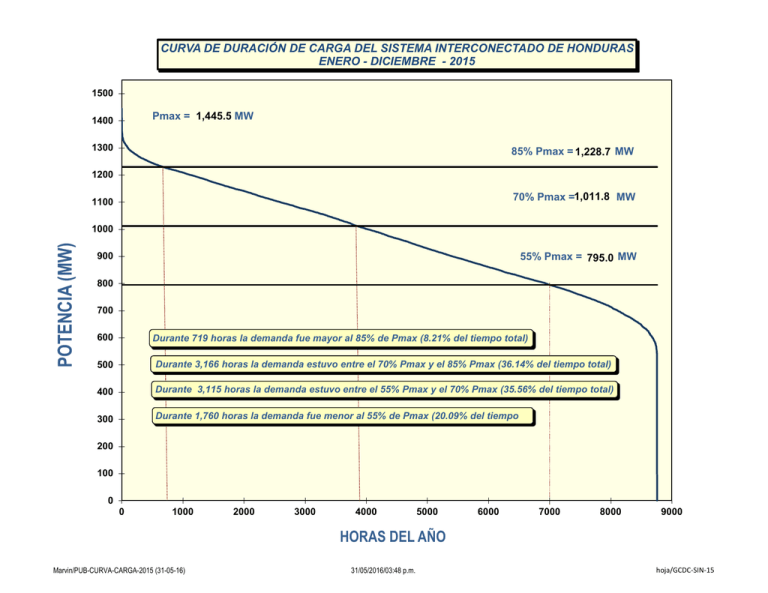
CURVA DE DURACIÓN DE CARGA DEL SISTEMA INTERCONECTADO DE HONDURAS ENERO - DICIEMBRE - 2015 1500 Pmax = 1,445.5 MW 1400 1300 85% Pmax = 1,228.7 MW 1200 70% Pmax =1,011.8 MW 1100 POTENCIA (MW) 1000 900 55% Pmax = 795.0 MW 800 700 600 Durante 719 horas la demanda fue mayor al 85% de Pmax (8.21% del tiempo total) 500 Durante 3,166 horas la demanda estuvo entre el 70% Pmax y el 85% Pmax (36.14% del tiempo total) 400 Durante 3,115 horas la demanda estuvo entre el 55% Pmax y el 70% Pmax (35.56% del tiempo total) 300 Durante 1,760 horas la demanda fue menor al 55% de Pmax (20.09% del tiempo 200 100 0 0 1000 2000 3000 4000 5000 6000 7000 8000 9000 HORAS DEL AÑO Marvin/PUB-CURVA-CARGA-2015 (31-05-16) 31/05/2016/03:48 p.m. hoja/GCDC-SIN-15


